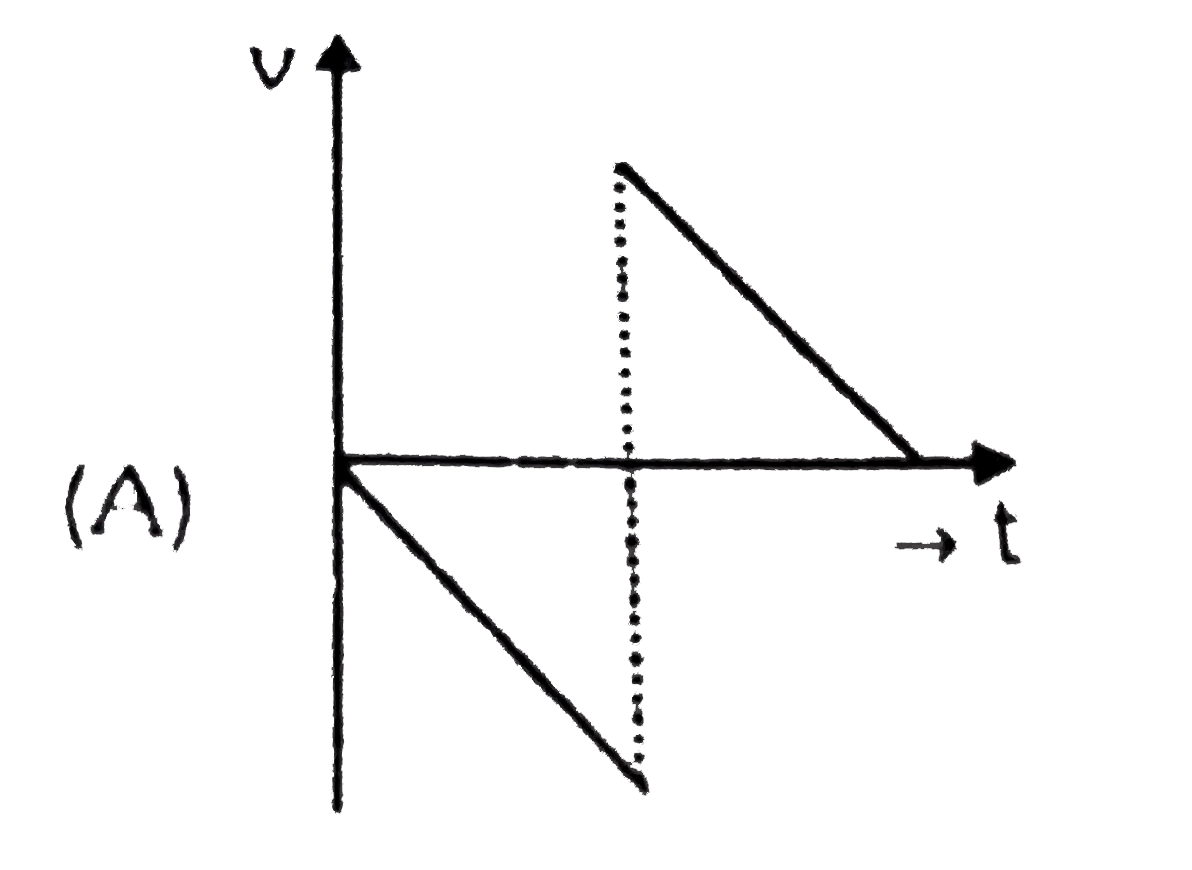
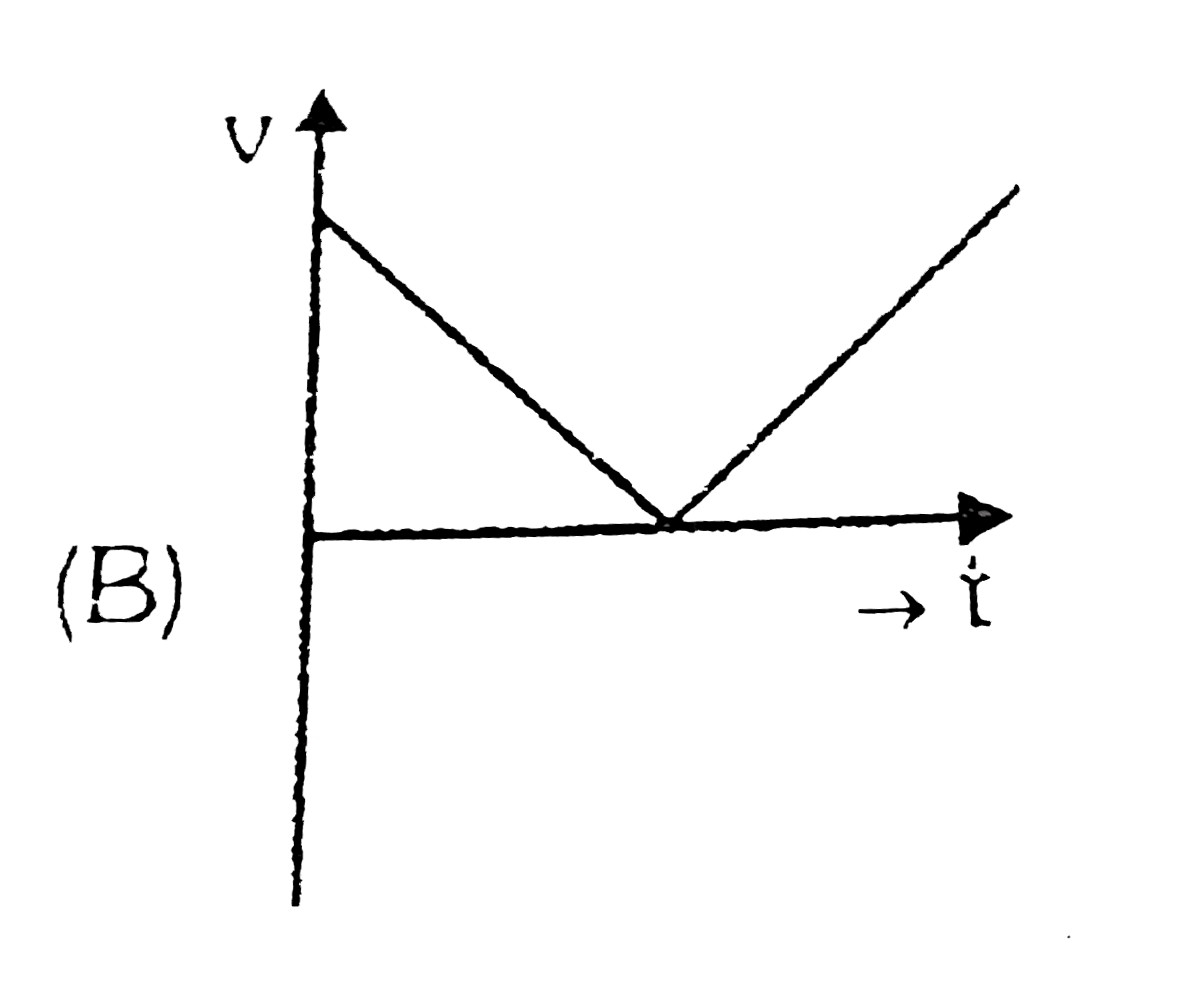
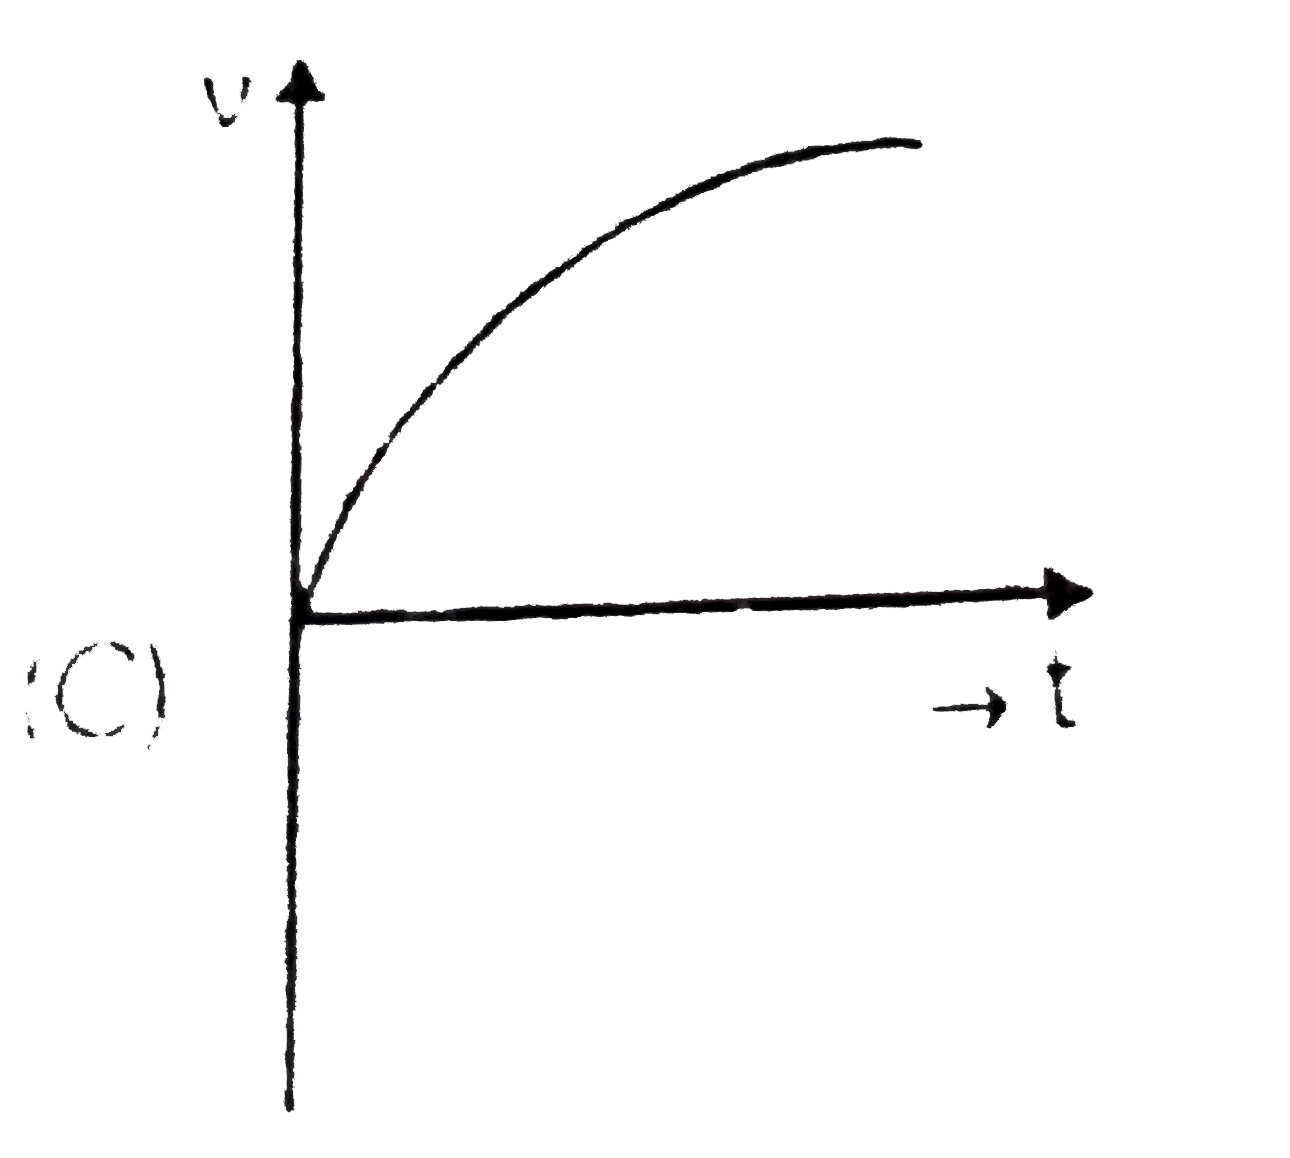
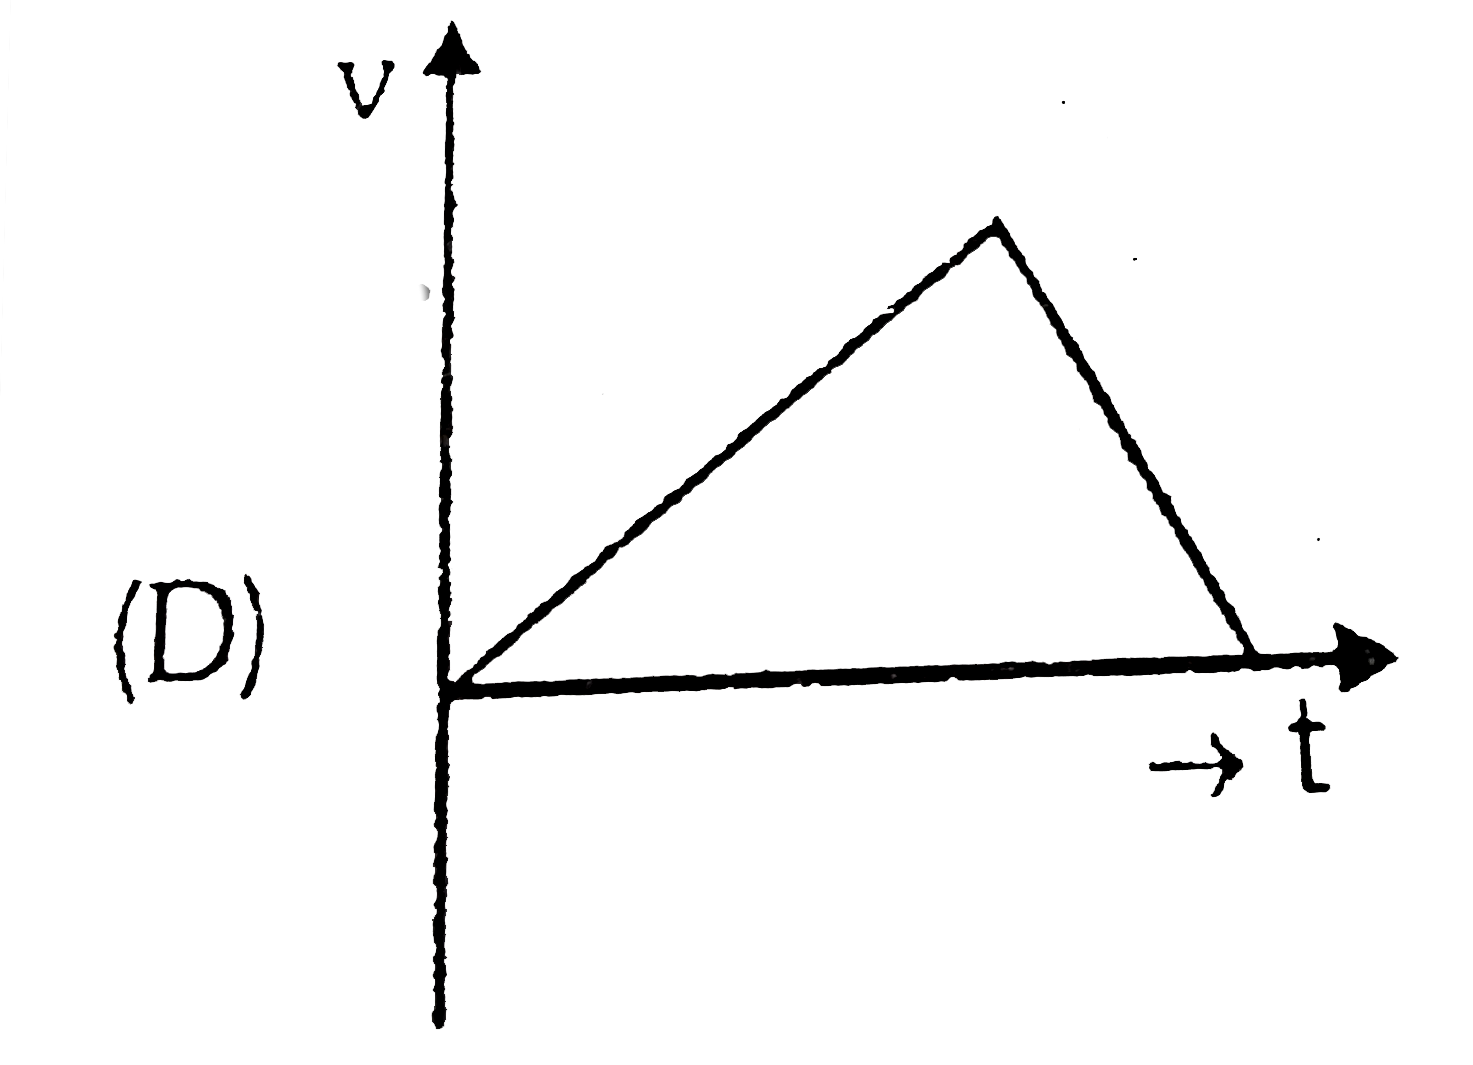
The velocity -time of a body falling from rest under gravity and rebounding from a solid surface is represented by which of the following graphs?Solution in Gujrati
The correct Answer is:A
Initially velocity increases downwards (negative) and after rebound it becomes positive and then speed us decreasing due to acceleration of gravoty
Topper's Solved these Questions
- KINEMATICSBOOK - ALLEN CHAPTER - KINEMATICSEXERCISE - EXERCISE-02
57 Videos
- KINEMATICSBOOK - ALLEN CHAPTER - KINEMATICSEXERCISE - EXERCISE-03
6 Videos
- KINEMATICSBOOK - ALLEN CHAPTER - KINEMATICSEXERCISE - EXERCISE-2
89 Videos
- ERROR AND MEASUREMENTBOOK - ALLEN CHAPTER - ERROR AND MEASUREMENTEXERCISE - Part-2(Exercise-2)(B)
22 Videos
- KINEMATICS (MOTION ALONG A STRAIGHT LINE AND MOTION IN A PLANE)BOOK - ALLEN CHAPTER - KINEMATICS (MOTION ALONG A STRAIGHT LINE AND MOTION IN A PLANE)EXERCISE - BEGINNER S BOX-7
8 Videos
Similar Questions
A particle is moving in a plane with velocity given by →u=u0ˆi+(aωcosωt)ˆj, where ˆi and ˆj are unit vectors along x and y axes respectively. If particle is at the origin at t=0. Calculate the trajectory of the particle :-
View SolutionThe equation of one dimensional motion of the particle is described in column I. At t=0, particle is at origin and at rest. Match the column I with the statement in Column II.
Column IColumn II(A)x=(3t2+2)m(p)Velocity of particle at t=1s is 8m/s(B)v=8tm/s(q)Particle moves with uniform acceleration(C)a=16t(r)Particle moves with variable acceleration(D)v=6t−3t2(s)Particle will change its direction some time
View SolutionA student performs an experiment to determine how the range of a ball depends on the velocity with which it is projected. The "range" is the distance between the points where the ball lends and from where it was projected, assuming it lands at the same height from which it was projected. It each trial, the student uses the same baseball, and launches it at the same angle. Table shows the experimental results.
∣∣ ∣ ∣ ∣ ∣ ∣∣TrailLaunch speed(m/s)Range(m)110822031.833070.7440122.5∣∣ ∣ ∣ ∣ ∣ ∣∣
Based on this data, the student then hypothesizes that the range, R, depends on the initial speed v0 according to the following equation : R=Cvn0, where C is a constant and n is another constant.
Based on this data, the best guess for the value of n is :-
View SolutionA cube has a side of length 1.2×10⁻²m. Calculate its volume.
View SolutionA football player kicks a ball at an angle of 30∘ with an initial speed of 20 m/s. Assuming that the ball travels in a vertical plane, calculate (a) the time at which the ball reaches the highest point (b) the maximum height reached (c) the horizontal range of the ball (d) the time for which the ball is in the air, (g=10m/s2)
View SolutionWhich graph in the following figure best represents the variation of velocity with time of a ball which bounces vertically on a hard surface, from the moment when it rebounds from the surface ?
View SolutionWhich of the following graph correctly represents velocity-time relationship for a particle released from rest to fall freely under gravity ?
View SolutionA body is projected vertically upward from the surface of the earth, then the velocity-time graph is:-
View SolutionThe distance(s) - time(t) graph which represents rainy drops which are falling from certain height with uniform velocity is
View SolutionRepresent a body under rest on a x-t graph.
View SolutionA particle falls from rest under the action of gravity . Variation of kinetic energy (KE) and potential energy (PE) of the particle , with time t is represented by the graph
View Solutionनिम्न में से कौन सा ग्राफ गुरुत्व के अंतर्गत स्वतंत्र रूप से गिरने वाली किसी वस्तु के वेग-समय परिवर्तन को प्रदर्शित करता है?
View SolutionWhich of the following graphs represents the velocity-time relationship for a falling apple?
View SolutionA body falls for 4s from rest. If the acceleration due to gravity of earth ceases to act, then the velocity and distance it travels in the next 3sec is
View SolutionAcceleration -time graph of a body starts from rest as shown below :
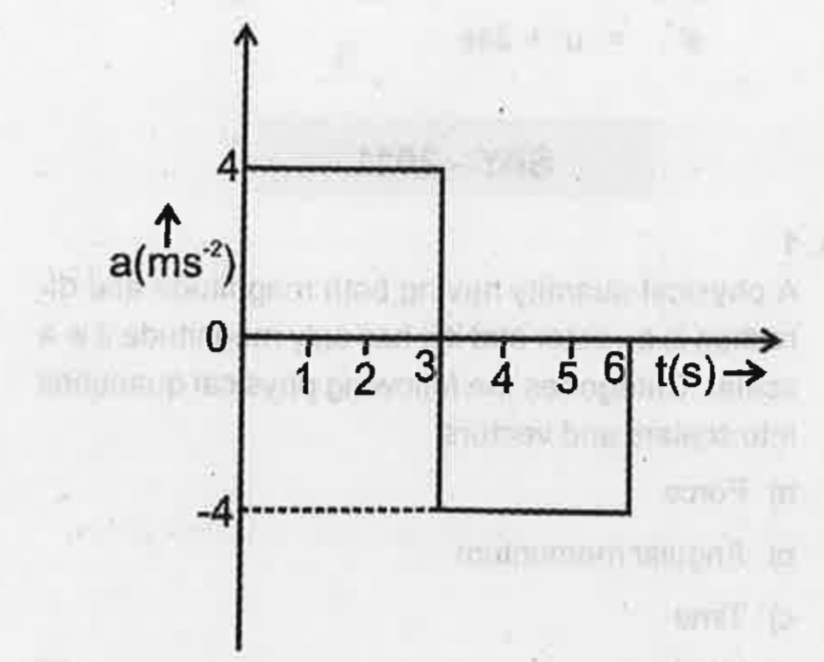
Draw the velocity-time graph using the above graph
View SolutionA body released from rest to fall freely under gravity reaches the ground in 4 s. Then the height from which it is released is
View Solution
