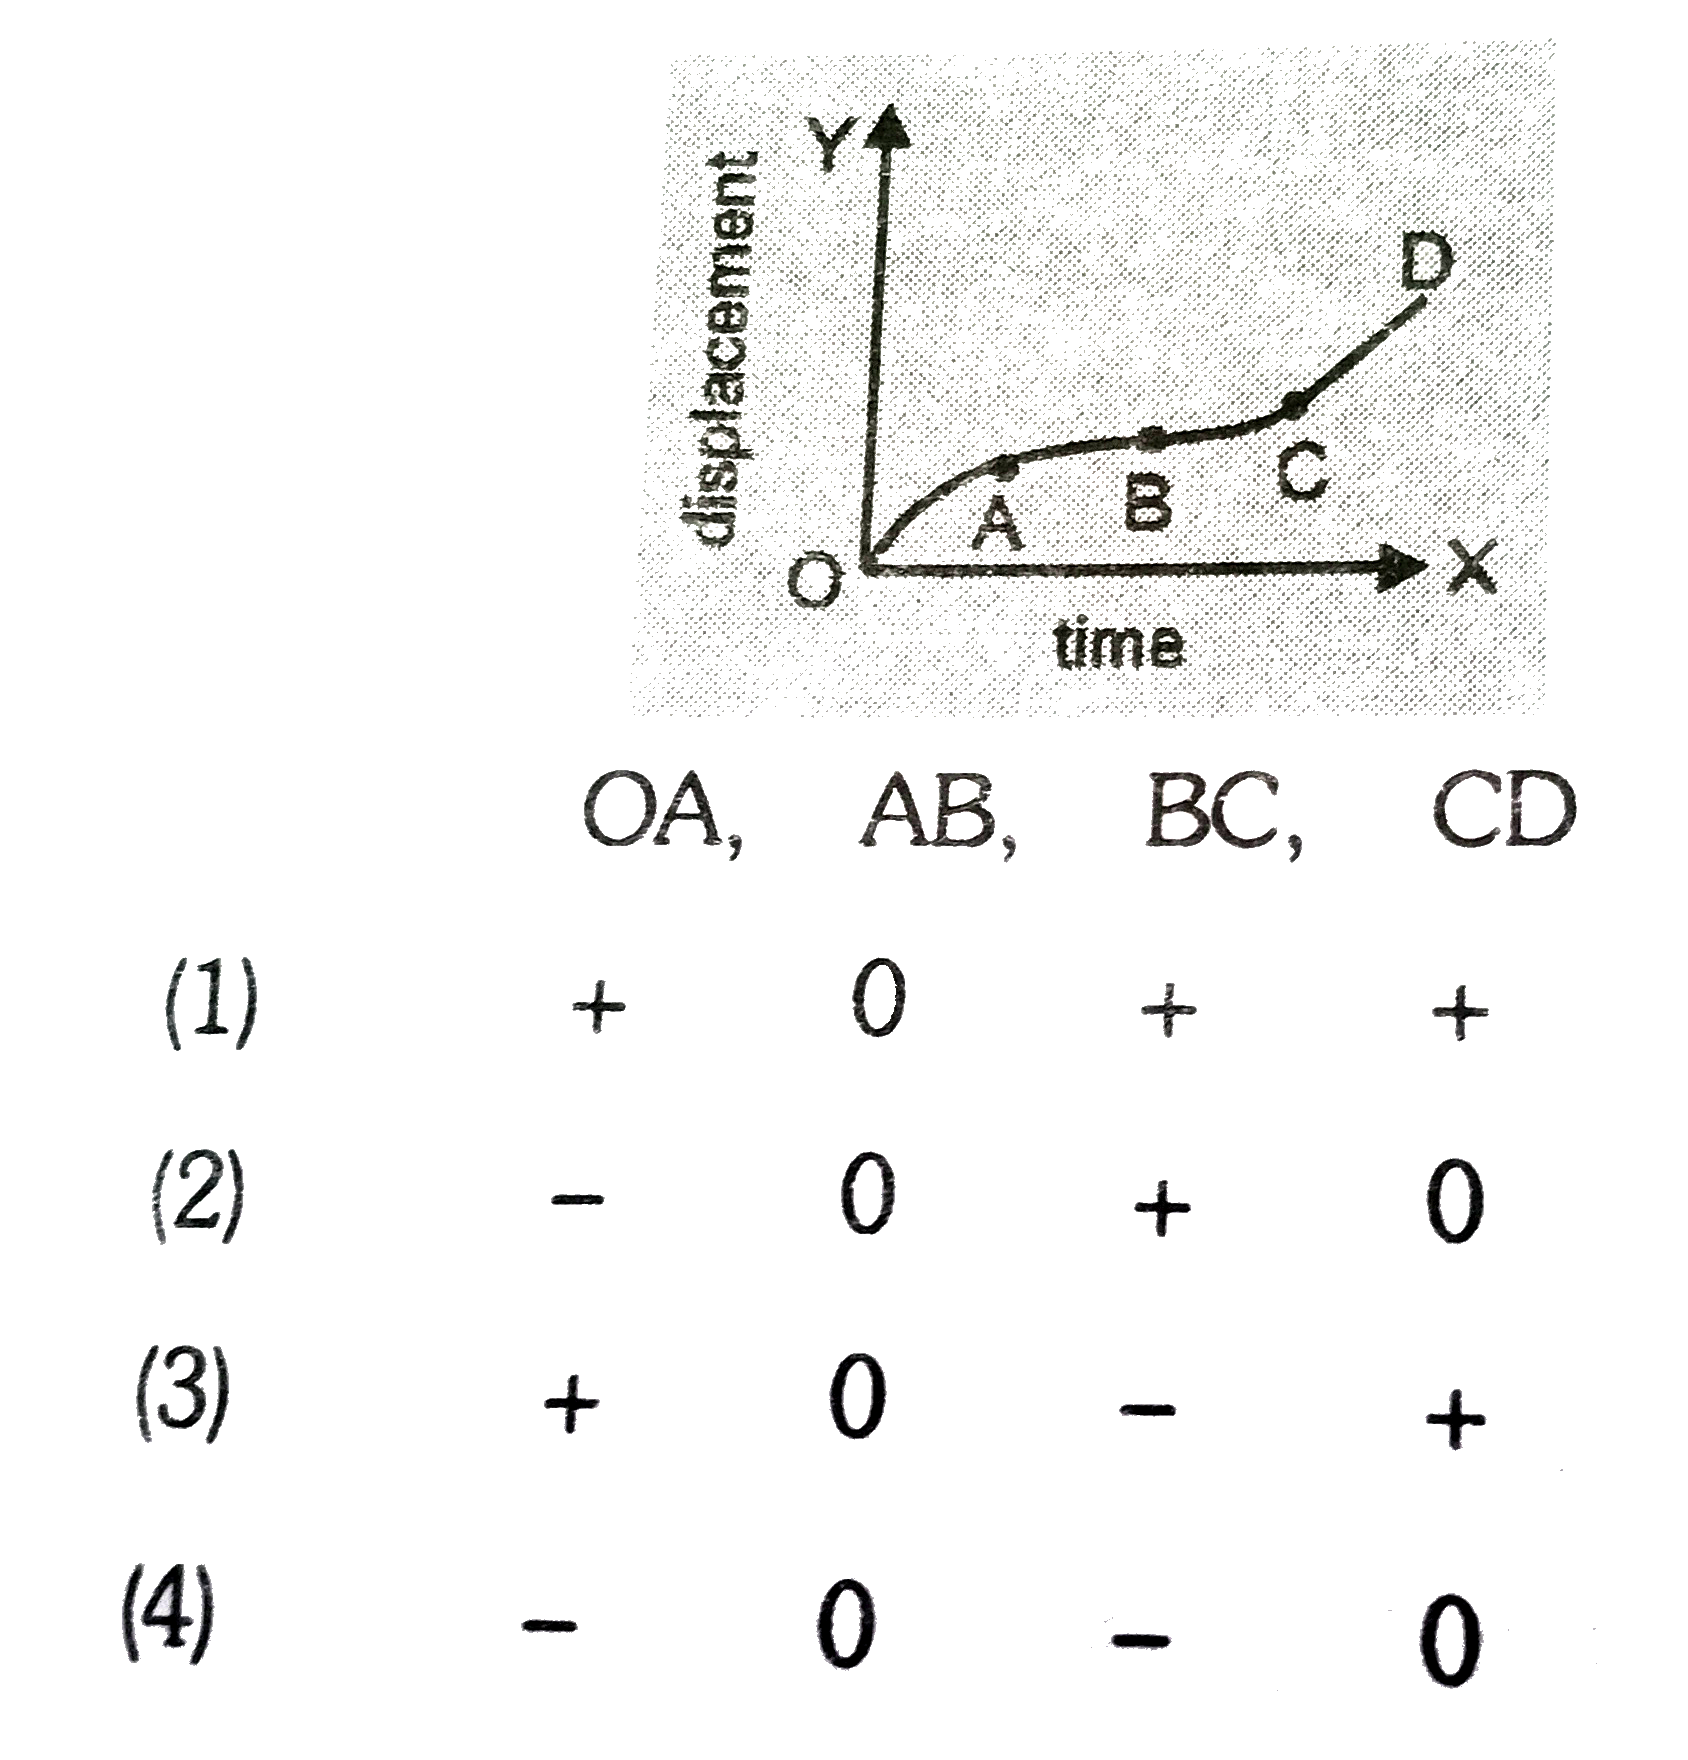
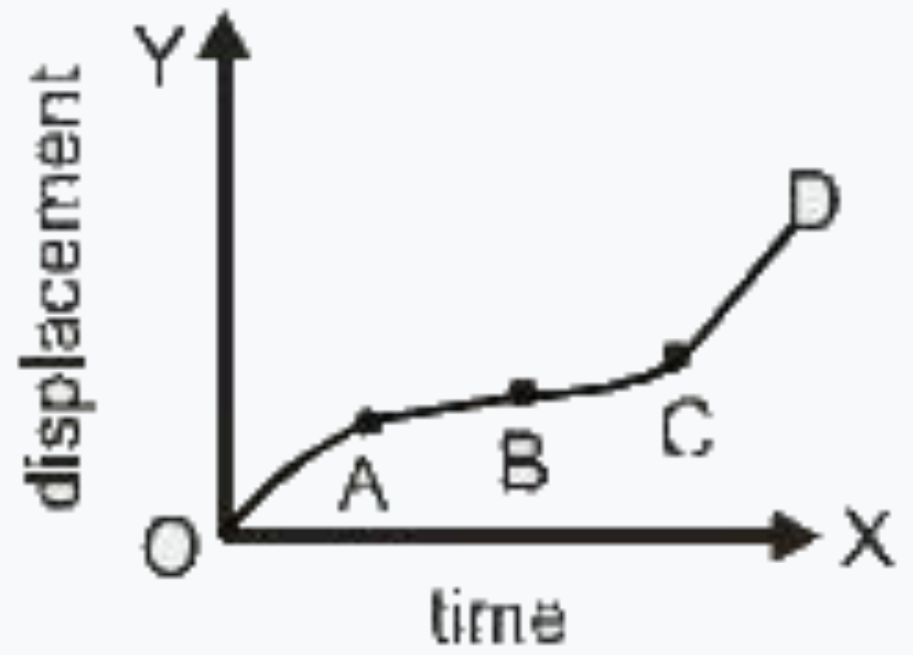
The graph between the displacement x and time t for a particle moving in a straigh lin ais shown in figure. During the internal OA,AB,BC and CD, the acceleration of the particle is:
 Solution in Gujrati
OA=+,AB=0,BC=+,CD=+
OA=−,AB=0,BC=+,CD=0
OA=+,AB=0,BC=−,CD=+
OA=−,AB=0,BC=0,CD=+
The correct Answer is:D
a=d2xdt2= change in velocity w.r.t the time
For OA→ velocity decreases so a is negative
For AB→ velocity constant so a is zero.
For BC→ velocity constant so a is zero
For CD→ velocity increases so a is positive.
Topper's Solved these Questions
- KINEMATICSBOOK - ALLEN CHAPTER - KINEMATICSEXERCISE - EXERCISE-02
57 Videos
- KINEMATICSBOOK - ALLEN CHAPTER - KINEMATICSEXERCISE - EXERCISE-03
6 Videos
- KINEMATICSBOOK - ALLEN CHAPTER - KINEMATICSEXERCISE - EXERCISE-2
89 Videos
- ERROR AND MEASUREMENTBOOK - ALLEN CHAPTER - ERROR AND MEASUREMENTEXERCISE - Part-2(Exercise-2)(B)
22 Videos
- KINEMATICS (MOTION ALONG A STRAIGHT LINE AND MOTION IN A PLANE)BOOK - ALLEN CHAPTER - KINEMATICS (MOTION ALONG A STRAIGHT LINE AND MOTION IN A PLANE)EXERCISE - BEGINNER S BOX-7
8 Videos
Similar Questions
A particle is moving in a plane with velocity given by →u=u0ˆi+(aωcosωt)ˆj, where ˆi and ˆj are unit vectors along x and y axes respectively. If particle is at the origin at t=0. Calculate the trajectory of the particle :-
View SolutionThe equation of one dimensional motion of the particle is described in column I. At t=0, particle is at origin and at rest. Match the column I with the statement in Column II.
Column IColumn II(A)x=(3t2+2)m(p)Velocity of particle at t=1s is 8m/s(B)v=8tm/s(q)Particle moves with uniform acceleration(C)a=16t(r)Particle moves with variable acceleration(D)v=6t−3t2(s)Particle will change its direction some time
View SolutionA student performs an experiment to determine how the range of a ball depends on the velocity with which it is projected. The "range" is the distance between the points where the ball lends and from where it was projected, assuming it lands at the same height from which it was projected. It each trial, the student uses the same baseball, and launches it at the same angle. Table shows the experimental results.
∣∣ ∣ ∣ ∣ ∣ ∣∣TrailLaunch speed(m/s)Range(m)110822031.833070.7440122.5∣∣ ∣ ∣ ∣ ∣ ∣∣
Based on this data, the student then hypothesizes that the range, R, depends on the initial speed v0 according to the following equation : R=Cvn0, where C is a constant and n is another constant.
Based on this data, the best guess for the value of n is :-
View SolutionA cube has a side of length 1.2×10⁻²m. Calculate its volume.
View SolutionA football player kicks a ball at an angle of 30∘ with an initial speed of 20 m/s. Assuming that the ball travels in a vertical plane, calculate (a) the time at which the ball reaches the highest point (b) the maximum height reached (c) the horizontal range of the ball (d) the time for which the ball is in the air, (g=10m/s2)
View SolutionDisplacement-time graph of a particle moving in a straight line is as shown in figure.
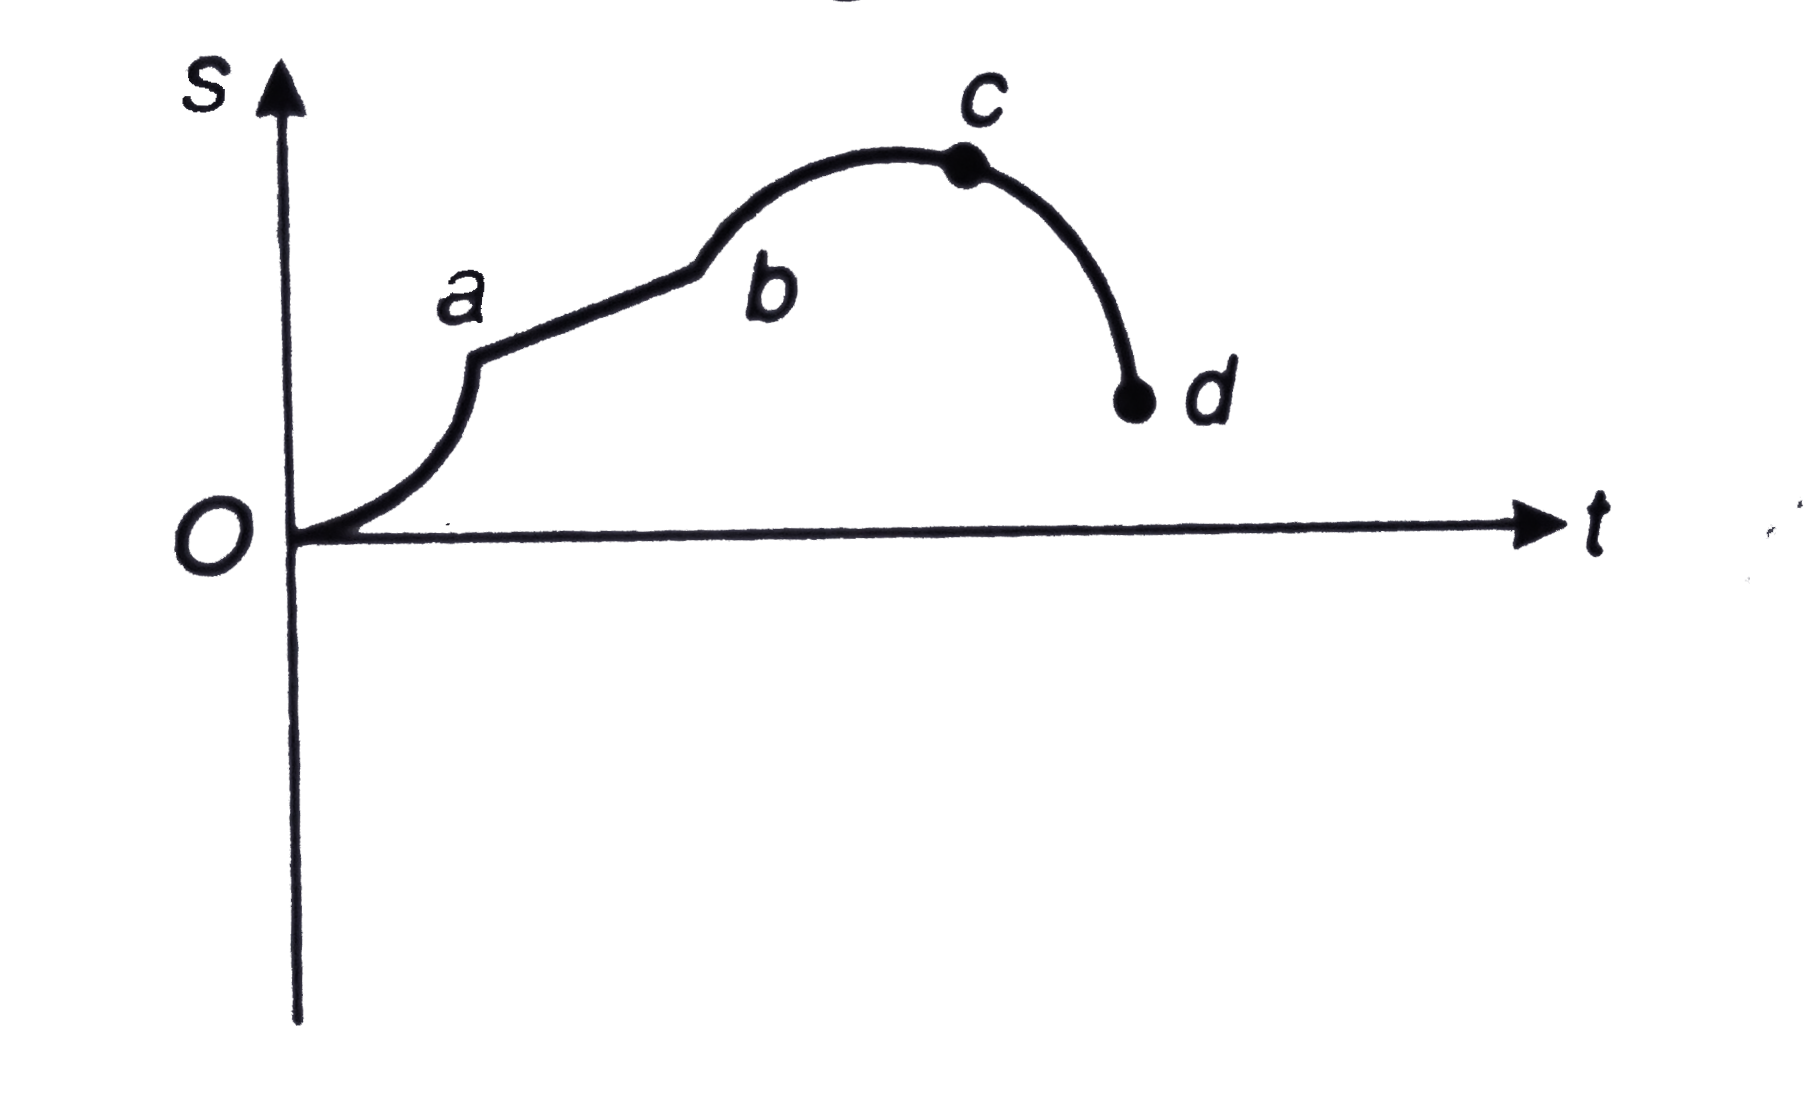
(a) Find the sign of velocity in regions oa,ab, bc and cd.
(b) Find the sign of acceleration in the above region.
View SolutionThe x-t graph of a particle moving along a straight line is shown in figure
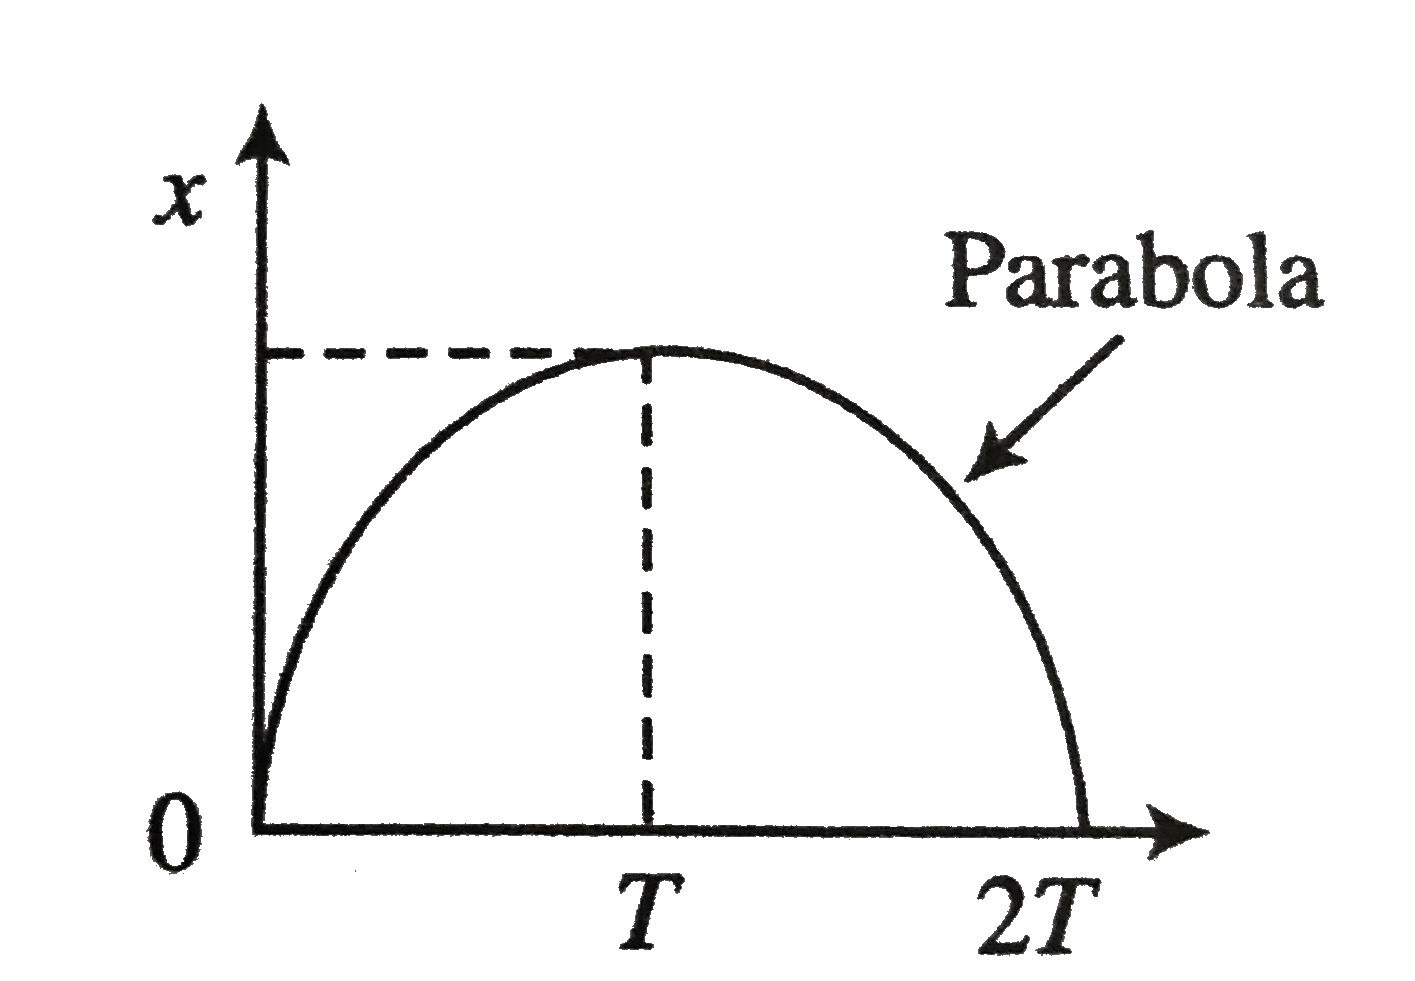
The speed-time graph of the particle is correctly shown by
View SolutionThe graph between the displacement x and time t for a particle moving in a straight line is shown in the figure. During the interval OA, AB, BC and CD the acceleration of the particle is OA, AB, BC, CD
View SolutionThe velocity -time (v - t) graph of a particle moving in a straight line is shown in figure. The acceleration of the particle at t = 9 is:
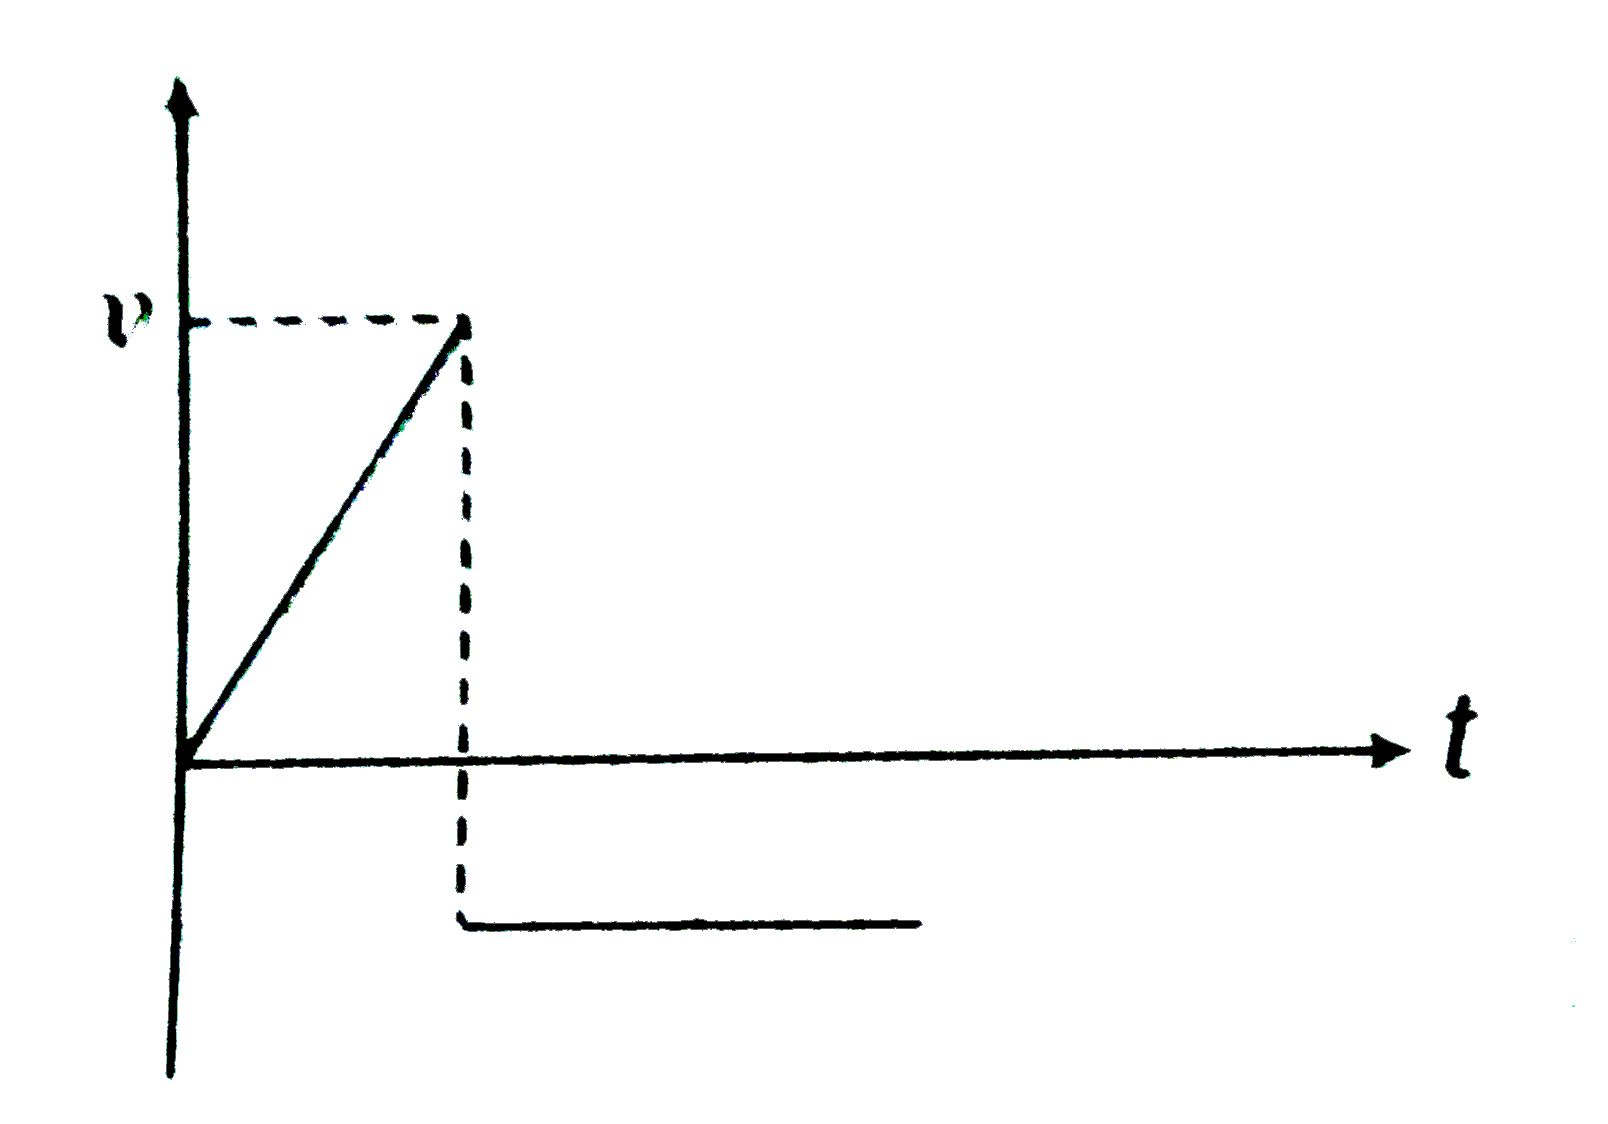
View SolutionThe velocity-time graph for a particle moving along X-axis is shown in the figure. The corresponding displacement-time graph is correctly shown by
View SolutionDisplacement-time graph of a particle moving in a straight line is as shown in figure. s t a o b c
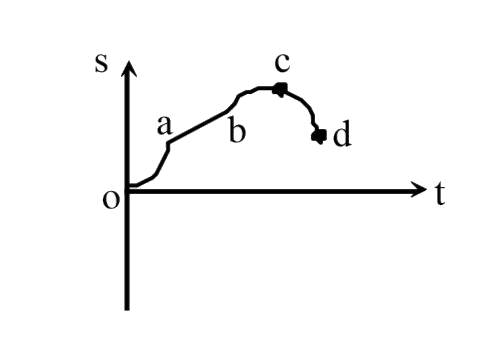
Q. Find the sign of velocity in regions oa, ab, bc and cd
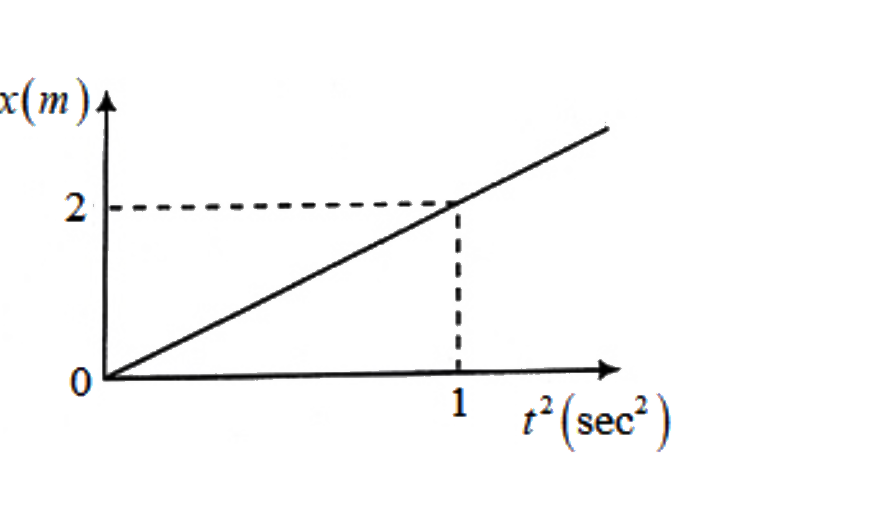
View SolutionDisplacement x versus t2 graph is shown for a particle. The acceleration of particle is
View Solutionएक सरल रेखा में गति करते हुए कण का विस्थापन-समय ग्राफ चित्र में दर्शाया गया है।
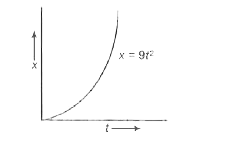
इस कण का त्वरण-समय ग्राफ है
View SolutionThe graph between the displacement x and time t for a particle moving in a straight line is shown in figure. During the interval OA, AB, BC and CD, the acceleration of the particles is
View Solutionचित्र में सरल रेखीय गति करते हुए कण के विस्थापन x व समय t में आरेख खींचा गया है। अन्तराल OA, AB, BC NCD के दौरान कण का त्वरण है
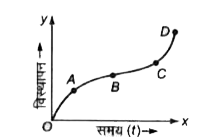
View Solutionचित्र में सरल रेखीय गति करते हुए कण के विस्थापन x व समय t के बीच ग्राफ दर्शाया गया है। अन्तराल OA, AB, BC व CD के दौरान कण का त्वरण
View Solution
