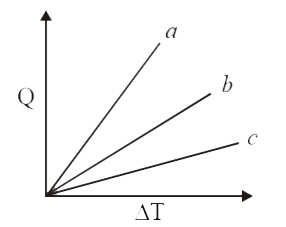
The straight lines in the figure depict the variations in temperature ΔT as a function of the amount of heat supplied Q is different process involving the change of state of a monoatomic and a diatomic ideal gas . The initial states, (P,V,T) of the two gases are the same . Match the processes as described, with the straight lines in the graph as numbered.
_E01_155_Q01.png)
Column-IColumn-II(A)Isobaric process of monoatomic gas.(p)1(B)Isobaric process of diatomic gas(q)2(C)Isochoric process of monoatomic gas(r)Minimum at section B(D)Isochoric process of diatomic gas(s)x-axis (i.e.'Q' axis)Solution in Gujrati
As Q=mCdt and dT=QnC
Therefore molar heat constant C is the determining factor for rate of change of temperature of a gas as heat is supplied to it. It is minimum for isochoric process of a monoatomic gas (CV=32R), resulting in greatest slope (dTQ) i.e.curve 1.
For isobaric process of monoatomic gas and isochoric process of diatomic gas, their heat capacities are same (52R) ,therefore both are represented by curve 2 .
For isobaric process of diatomic gas Cp=72R that is represented by curve 3.Q axis represent by curve isothermal process and ΔT axis represent adiabatic process.
Topper's Solved these Questions
- GEOMETRICAL OPTICSBOOK - ALLEN CHAPTER - GEOMETRICAL OPTICSEXERCISE - ASSERTION-REASON
40 Videos
- GEOMETRICAL OPTICSBOOK - ALLEN CHAPTER - GEOMETRICAL OPTICSEXERCISE - Comprehension Based Questions
66 Videos
- GEOMETRICAL OPTICSBOOK - ALLEN CHAPTER - GEOMETRICAL OPTICSEXERCISE - EXERCISE -02
82 Videos
- CURRENT ELECTRICITYBOOK - ALLEN CHAPTER - CURRENT ELECTRICITYEXERCISE - EX.II
66 Videos
- GRAVITATIONBOOK - ALLEN CHAPTER - GRAVITATIONEXERCISE - EXERCISE 4
9 Videos
Similar Questions
Statement-1: A real gas behaves as an ideal gas at high temperature and low pressure .
Statement-2: Liquid state of an ideal gas is impossible.
View SolutionA certain amount of ice is supplied heat at a constant rate for 7 min. For the first one minute the temperature rises uniformly with time. Then it remains constant for the next 4 min and again the temperature rises at uniform rate for the last 2 min. Given Sice=0.5cal/g∘C,Lf=80cal/g.
The initial temperature of ice is
View SolutionA triangular plate has two cavities , one square and one rectangular as shown in figure . The plate is heated.
_E01_066_Q01.png)
View SolutionIn the Bohr's model of hy drogen atom, the electron moves around the nucleus in a circular orbit of radius 5×10⁻¹¹m. Its time period is 1.5×10⁻¹⁶s. The current associated with the electron motion is:-
View SolutionAssertion : The difference in the value of acceleration due to gravity at pole and equator is proportional to square of angular velocity of earth.
Reason : the value of acceleration due to gravity is minimum at the equator and maximum at the pole.
View SolutionStraight line on (p - T) graph for an ideal gas represents isochoric process.
If p∝T,V=constant.
View SolutionA gas take part in two thermal processes in which it is heated from the same initial state to the same final temperature. The processes are shown on the P-V diagram by straight lines 1 rarr 3 and 1 rarr 2
View SolutionA gas take part in two thermal processes in which it is heated from the same initial state to the same final temperature. The processes are shown on the P-V diagram by straight lines 1 rarr 3 and 1 rarr 2
View SolutionV-T graph of a process of monoatomic ideal gas is shown in figure. Heat is supplied to the gas in process(s)-
View SolutionV-T graph of a process of monoatomic ideal gas is shown in figure. Change in internal energy of the gas is zero in process(s)-
View SolutionFigure shows the variation in temperature (DT) with the amount of heat supplied (Q) in an isobaric process corresponding to a monoatomic (M), diatomic (D) and a polyatomic (P) gas. The initial state of all the gases are the same and the scales for the two axes coincide. Ignoring vibrational degrees of freedom, the lines a, b and c respectively correspond to

View SolutionThe graph shown below is a graph between work done on the gas versus heat supplied to it. Different lines OA, OB, OC, OD represent different processes on monoatomic gas or a diatomic gas. Match the correct process with the line. {:("List I",,"List II"),("P. OA",,"1. Adiabatic Process"),("Q. OB",,"2. Isobaric process for monoatomic gas"),("R. OC",,"3. Isothermal process"),("S. OD",,"4.Isobaric process for diatomic gas"):}
View SolutionThe amount of heat supplied to an ideal gas is laid off on the horizontal axis and the amount of work performed by the g-as is laid off on the vertical axis. One of the straight lines in the ligure is an isotherm and the other two are isobars of two gases. The initial states of hoth gases (pressure, temperature, volume) are the same, and the scales on the two axes coincide. Which straight line corresponds to which process? How many degrees of freedom does each gas have? (Vibrational degrees of freedom are not to be taken into account.) The graphs of what processes coincide with the coordinate axes?
View SolutionMatch the column : (Given process does not include chemical reactionn and phase change)
Column-IColumn-II(a)ΔH=ΔU+Δ(PV)(P)Any matter undergong any process(b)ΔH=n.CPΔT(q)Isochoric process involving any substance(c)q=ΔU(r)Ideal gas,under any process(d)ΔH=ΔU+nRΔT(s)Ideal gas under isothermal process(t)Anysubstance undergoing isobaric process
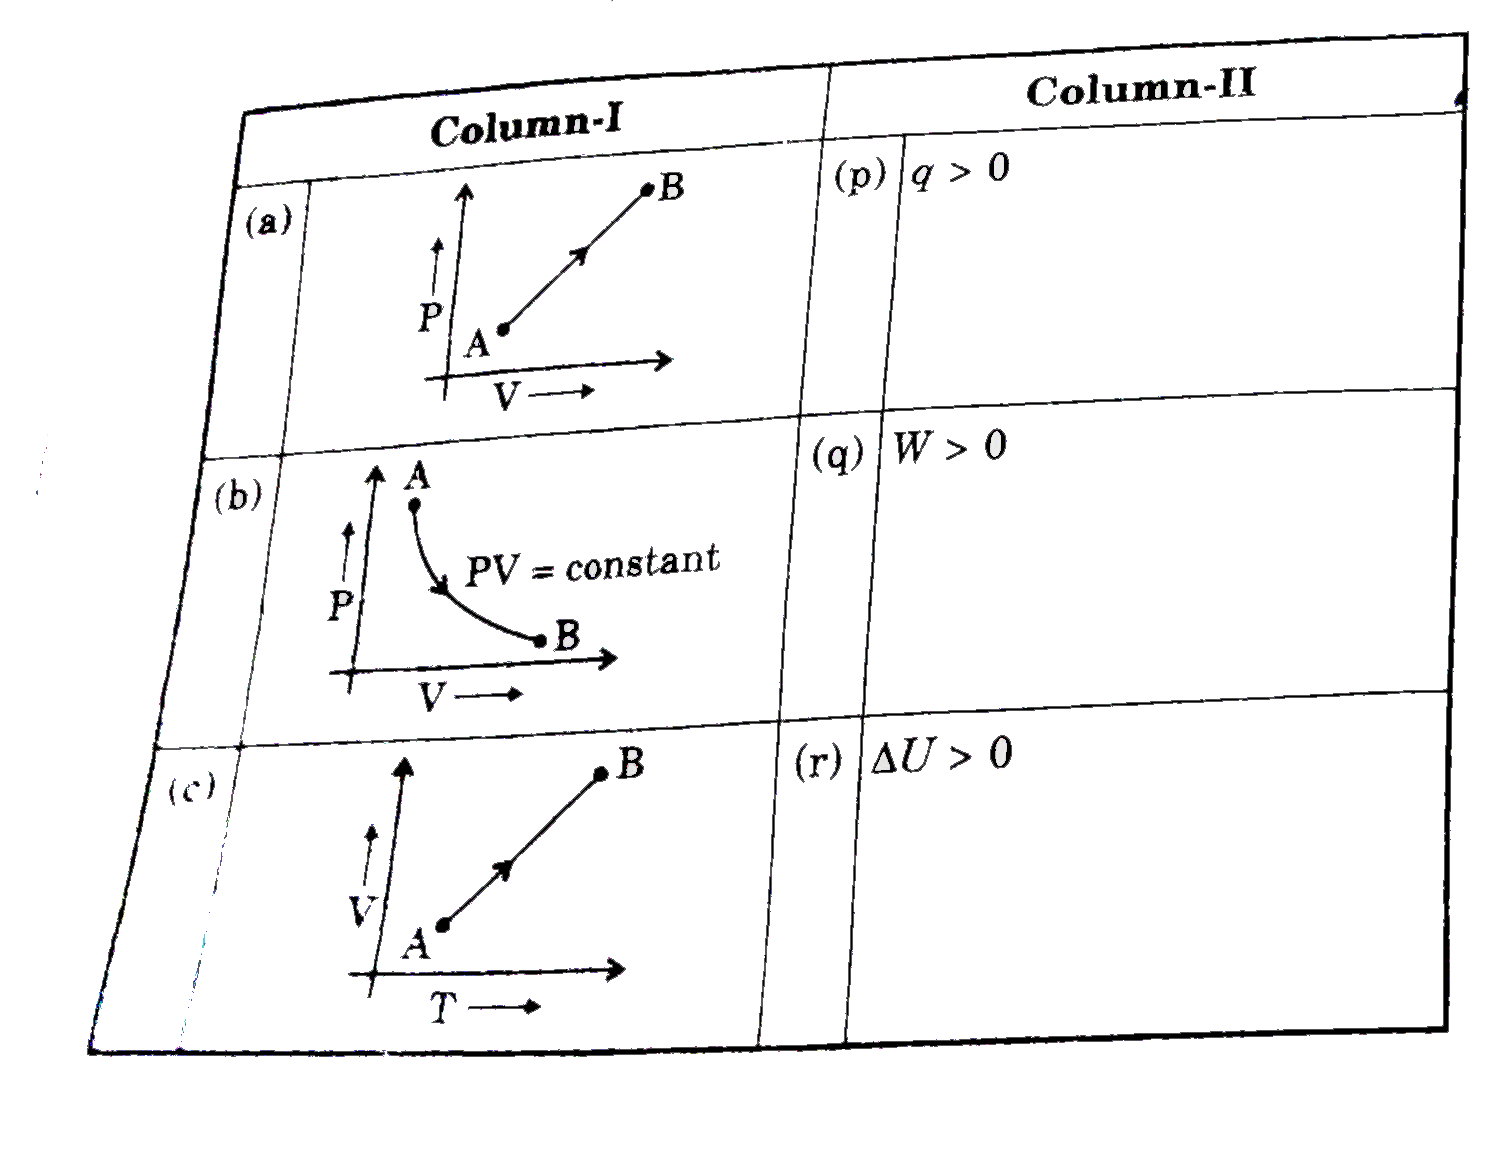
View SolutionOne mole of an ideal gas going from state-A to state-B through different processes. Column-I shows graph of the process and column-II shows change in parameter in these process. Match the following:

View SolutionFigure (Five straight line numbered 1, 2, 3, 4 and 5) shows graph of change in temperature Delta T verusus heat supplied Delta Q for different process performed on a gas of one mole.
View Solution
