Draw a graph showing the variation of decay rate with number of active nuclei. NCERT Exemplar
We know that, rate of decay
where, decay constant is constant for a given radioactive material. Therefore, graph between N and is a straight line as shown in the figure.

Similar Questions
Knowledge Check
- Question 1 - Select One
The graph showing the variation of decay rate with number of nuclei is:
A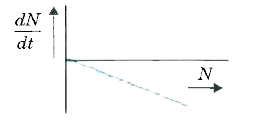 B
B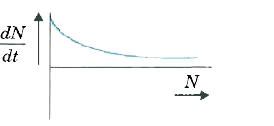 C
C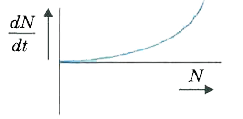 D
D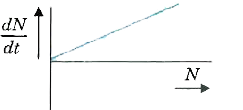
Draw the graph showing the variation of binding energy per nucleon with mass number. Give the reason for the decrease of binding energy per nucleon for nuclei with high mass numbers.
View SolutionDraw the graph showing thervariation of binding energy per nucleon with mass number. Give therason for the decrease of binding energy per nucleon for nuclei with high mass numbers.
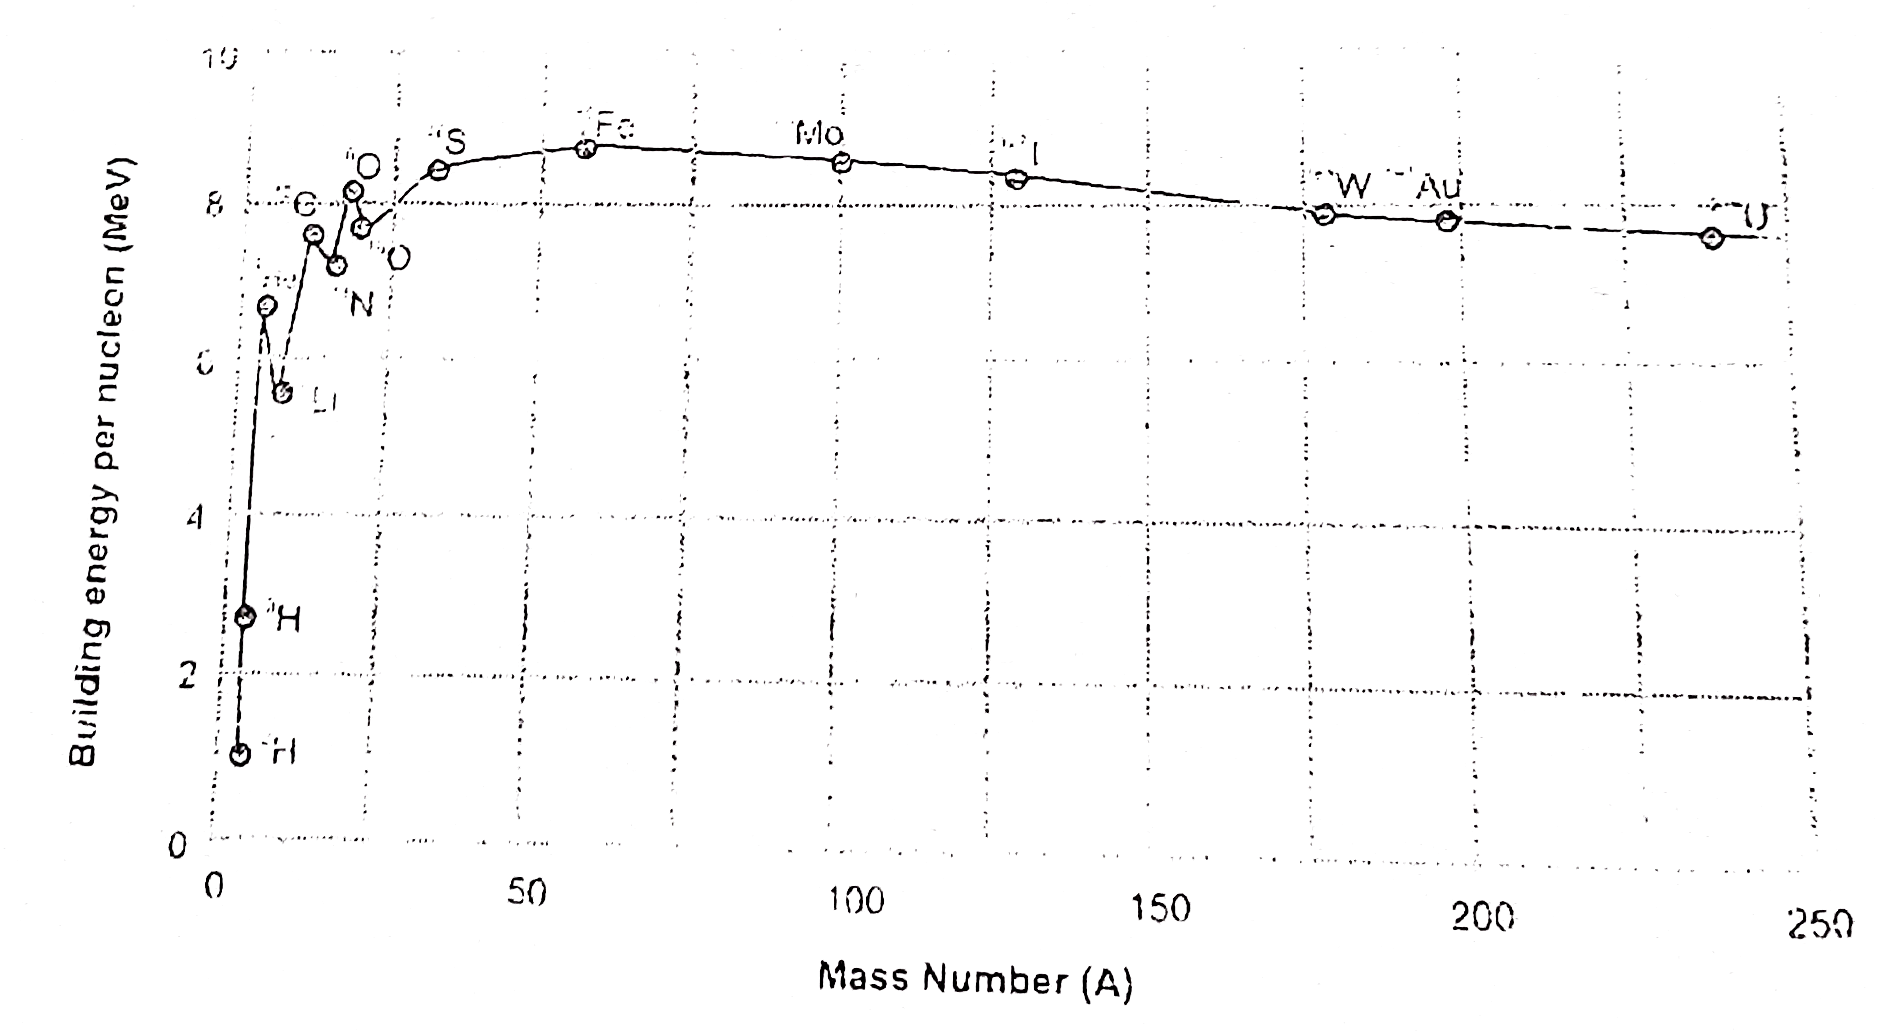
The binding energy per nucleon for nuclei with high mass number is low due to the large coulomb repulsion between the protons inside these nuclei.View SolutionDraw the graph showing thervariation of binding energy per nucleon with mass number. Give therason for the decrease of binding energy per nucleon for nuclei with high mass numbers.

The binding energy per nucleon for nuclei with high mass number is low due to the large coulomb repulsion between the protons inside these nuclei.View SolutionDraw a graph showing the variation of resistivity with temperature for nichrome. Which property of nichrome is used to make standard resistance coils?
View SolutionDraw a graph showing variation of de-Broglie wavelength with the momentum of an electron.
View SolutionDraw a graph showing variation of binding energy per nucleon with mass number. Write two main inferences drawn from the graph.
View SolutionVARIATION OF BINDING ENERGY OF PER NUCLEON WITH MASS NUMBER
View Solution

