In the given (V - T) diagram, what is the relation between pressures P1 and P2?
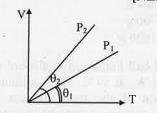 Solution in Marathi
P2=P1
P2>P1
P2<P1
Cannot be predicted
Step by step video & image solution for In the given (V - T) diagram, what is the relation between pressures P_1 and P_2? by Physics experts to help you in doubts & scoring excellent marks in Class 11 exams.
Updated on:21/07/2023Topper's Solved these Questions
Similar Questions
Wave motion is a propagation of disturbance through the medium in terms of __________
View SolutionThe volume V versus temperature T graphs for a cetain amount of a perfect gas at two pressure p1andp2 are as shown in Fig. It follows from the graphs that p1 is greater than p2.
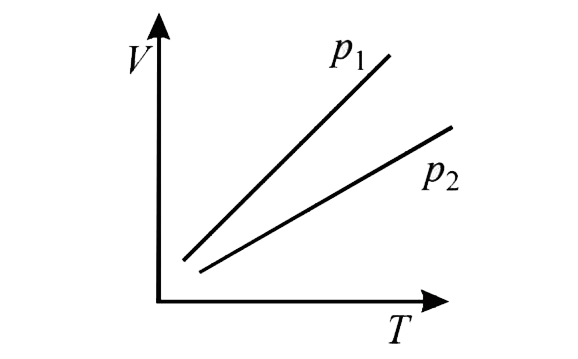
View SolutionIn the given (V-T) diagram, what is the relation between pressure P_(1) and P_(2) ?
View SolutionFor V versus T curves at constant pressure P1andP2 for and ideal gas shown in figure-
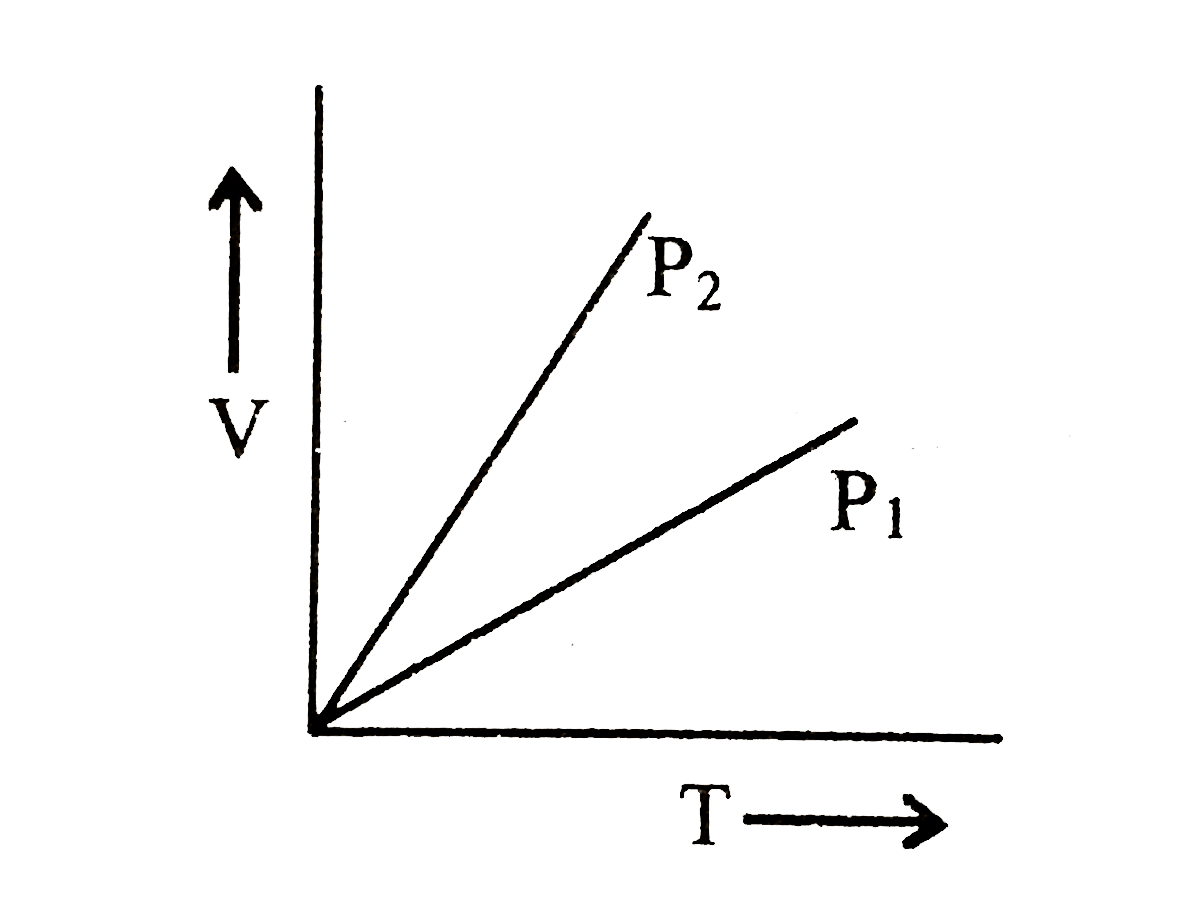
View SolutionIn V-T diagram shown in fig., what is the relation between P1andP2 ?
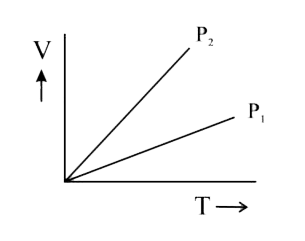
View SolutionFigure 6.18 shows the V-T graph for a fixed mass of an ideal gas at pressure p_1 and p_2 . Can you infer from the graph whether p_1 is greater than p_2 ?
View Solutionপ্রদত্ত V−T লেখচিত্রে চাপ p1 এবং p2 এর মধ্যে সম্পর্ক কী?
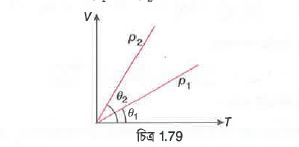
View SolutionIn the given (V-T) diagram, what is the relation between pressures P_(1) and P_(2) ?
View SolutionFor an ideal gas V-T curves as constant pressures P1&P2 are shown in figure - from the figure
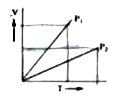
View SolutionEstablish the relation : Dalton's law of partial pressure: p=p_1+p_2+p_3+…..
View SolutionIn the given (V-T) diagram, what is the relation between pressure P_(1) and P_(2) ?
View Solution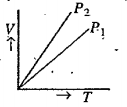
V versus T curves at constant pressure P1 and P2 for an ideal gas are shown in fig.
View SolutionIn the given (V-T) diagram, what is the relation between pressure P1andP2 ?
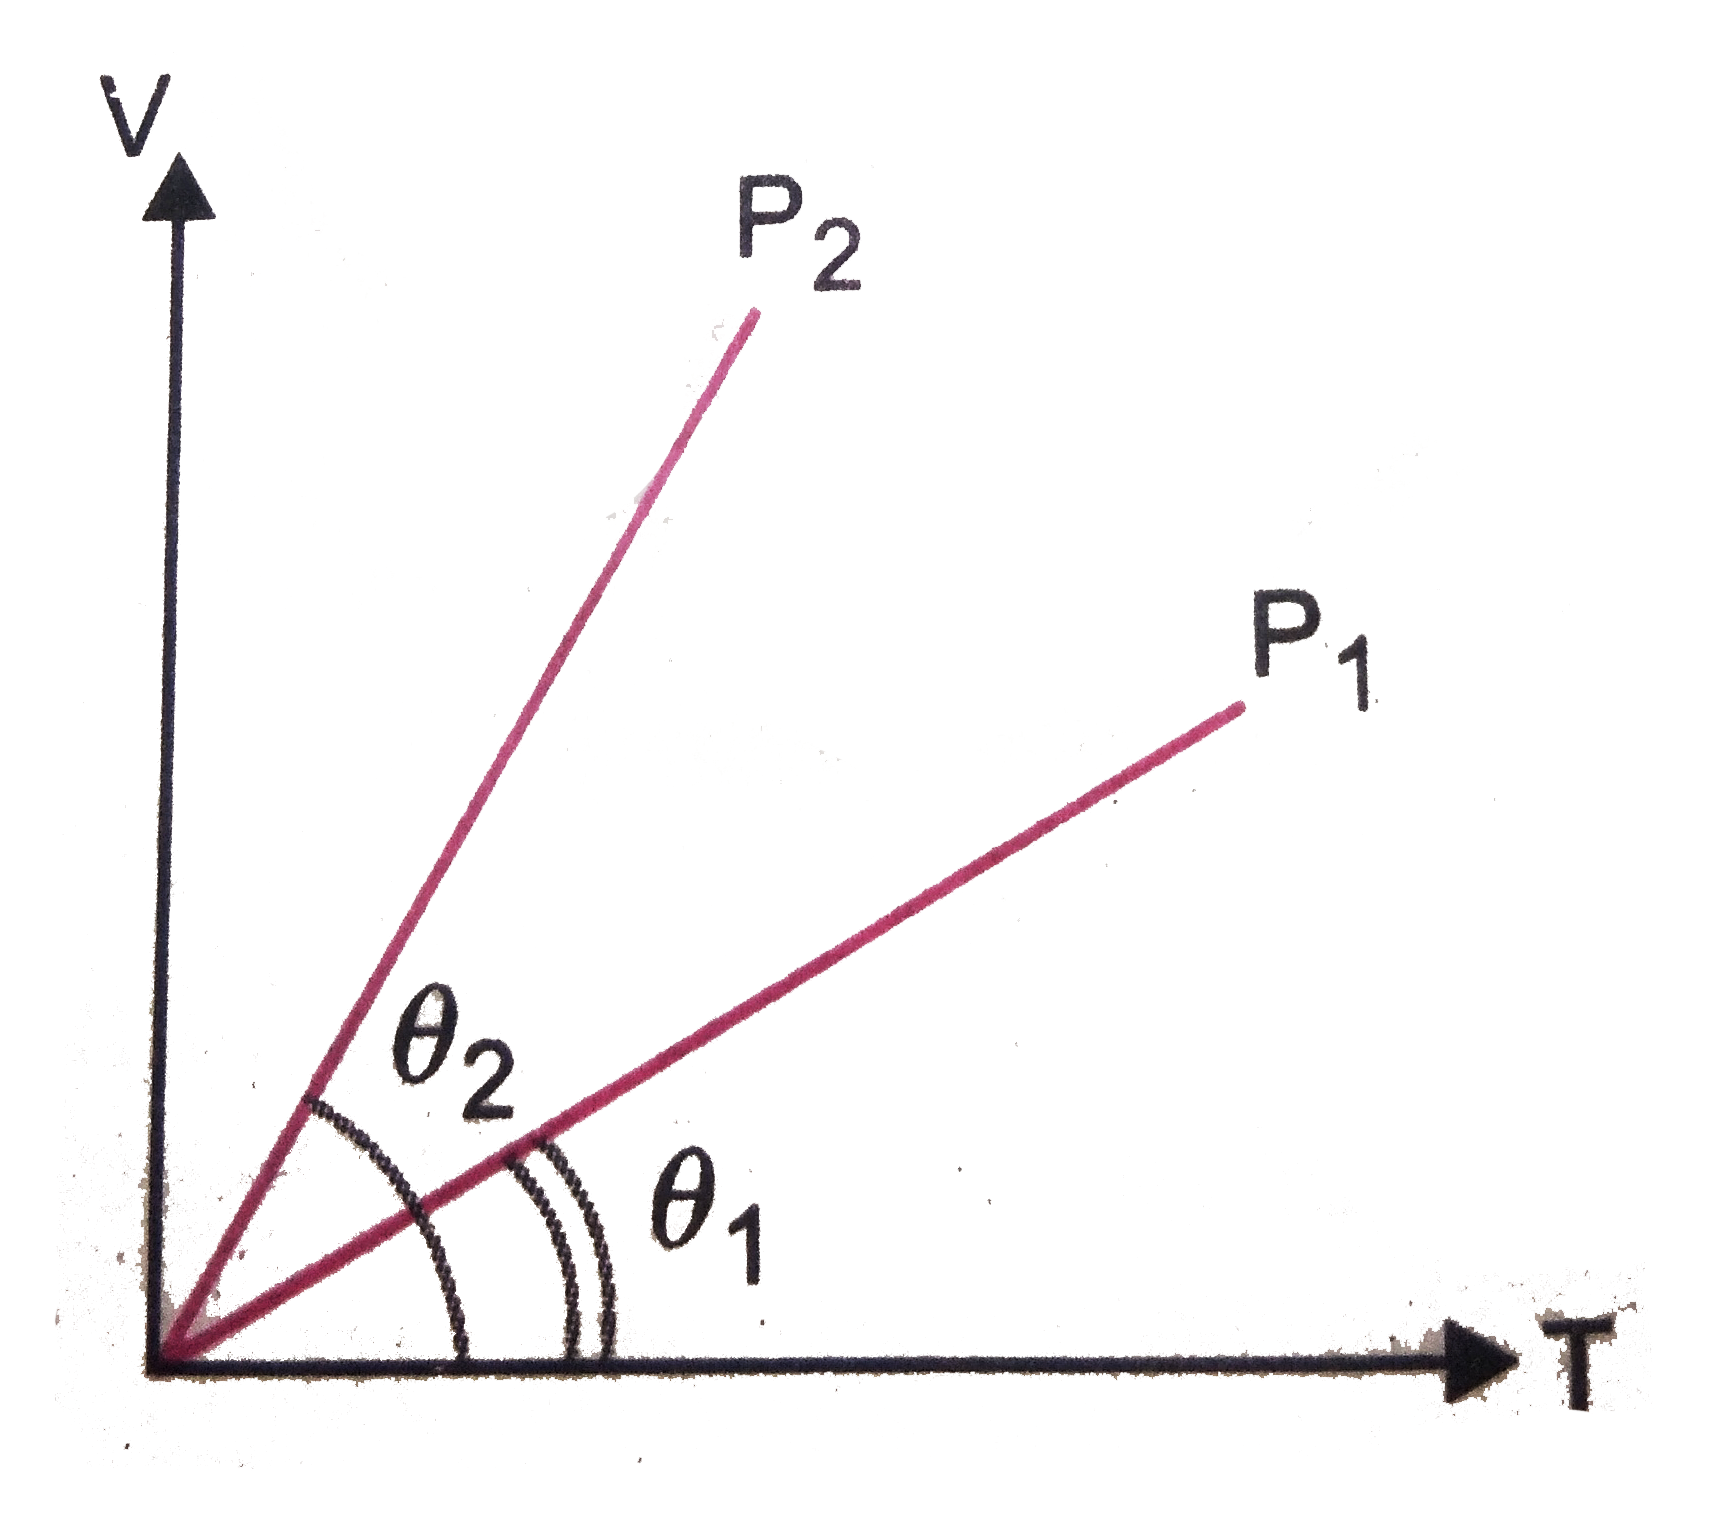
View SolutionThe volume V versus temperature T graphs for a certain amount of a perfect gas at two pressure p_1 and p_2 are as shown in Fig. Show that p_1 is less than p_2.
View SolutionV vs T curves at constant pressure P_1 and P_2 for an ideal gas are shown in the figure. Which of the following is correct?
View SolutionIn the given (V-T) diagram, what is the relation between pressure P_(1) and P_(2) ?
View Solution
