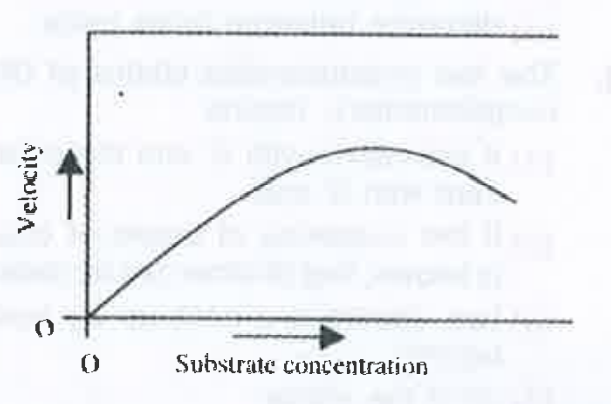
What does the graph indicate ?
The graph given below shows the effect of substrate concentration on the rate of reaction of the enzyme green- gram-phos-phatase.
Formation of enzyme substrate complex
Increase of pH at higher concentration of substrate
presence of enzyme inhibitor
Rate of reaction is directly proportional to substrate concentration.
The correct Answer is:C
Step by step video & image solution for What does the graph indicate ? The graph given below shows the effect of substrate concentration on the rate of reaction of the enzyme green- gram-phos-phatase. by Biology experts to help you in doubts & scoring excellent marks in Class 12 exams.
Updated on:21/07/2023Topper's Solved these Questions
- MOLECULES OF THE CELLBOOK - DINESH PUBLICATION ENGLISHCHAPTER - MOLECULES OF THE CELLEXERCISE - CYG
43 Videos
- MOLECULES OF THE CELLBOOK - DINESH PUBLICATION ENGLISHCHAPTER - MOLECULES OF THE CELLEXERCISE - CYG
43 Videos
- MICROBES IN HUMAN WELFAREBOOK - DINESH PUBLICATION ENGLISHCHAPTER - MICROBES IN HUMAN WELFAREEXERCISE - Brain Teasers-VIII
60 Videos
- MOLLUSCABOOK - DINESH PUBLICATION ENGLISHCHAPTER - MOLLUSCAEXERCISE - CYG
10 Videos
Similar Questions
A: Coenzymes are usually proteins
R:The term feedback refers to the effect of enzyme concentration on its rate of reaction.
View SolutionIf you study the effect of substrate concentration on an enzymatic reaction, what kind of curve would you obtain?
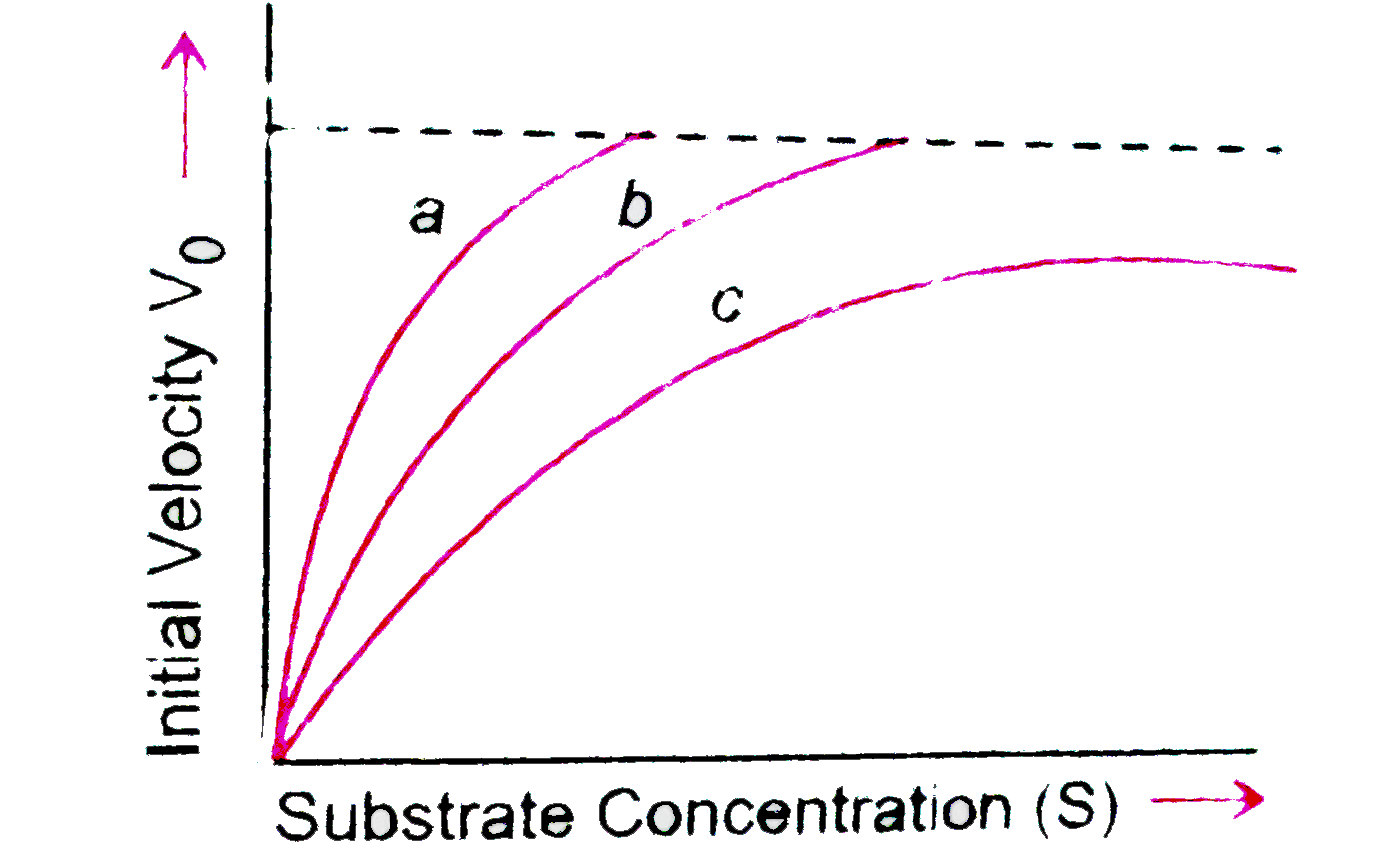
View SolutionFigure given below shows three velocity-substrate concentration curves for an enzyme reaxtion. What do the curves for an enzyme reaction. What do the curves depict
View SolutionWhich one of the given graphs shows the effect of temperature on the velocity of a typical enzymatic reaction ?
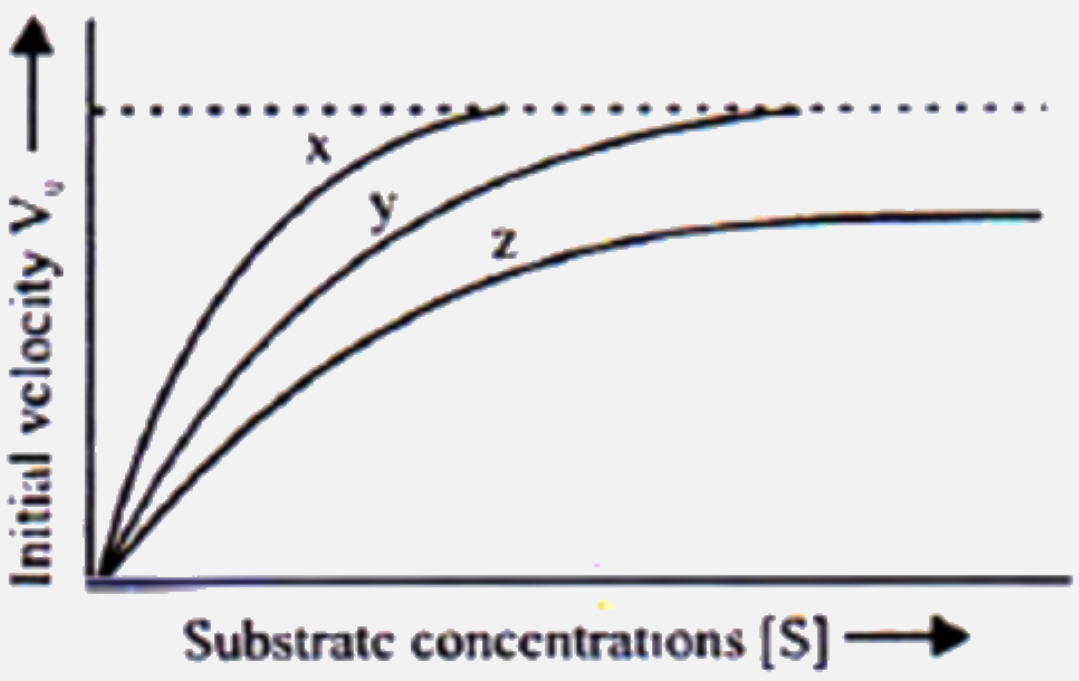
View SolutionThe Given figure shows three velocity-substrate concentration curves of an enzyme reaction. What do the curves X Y and Z depict respectively ?
View Solution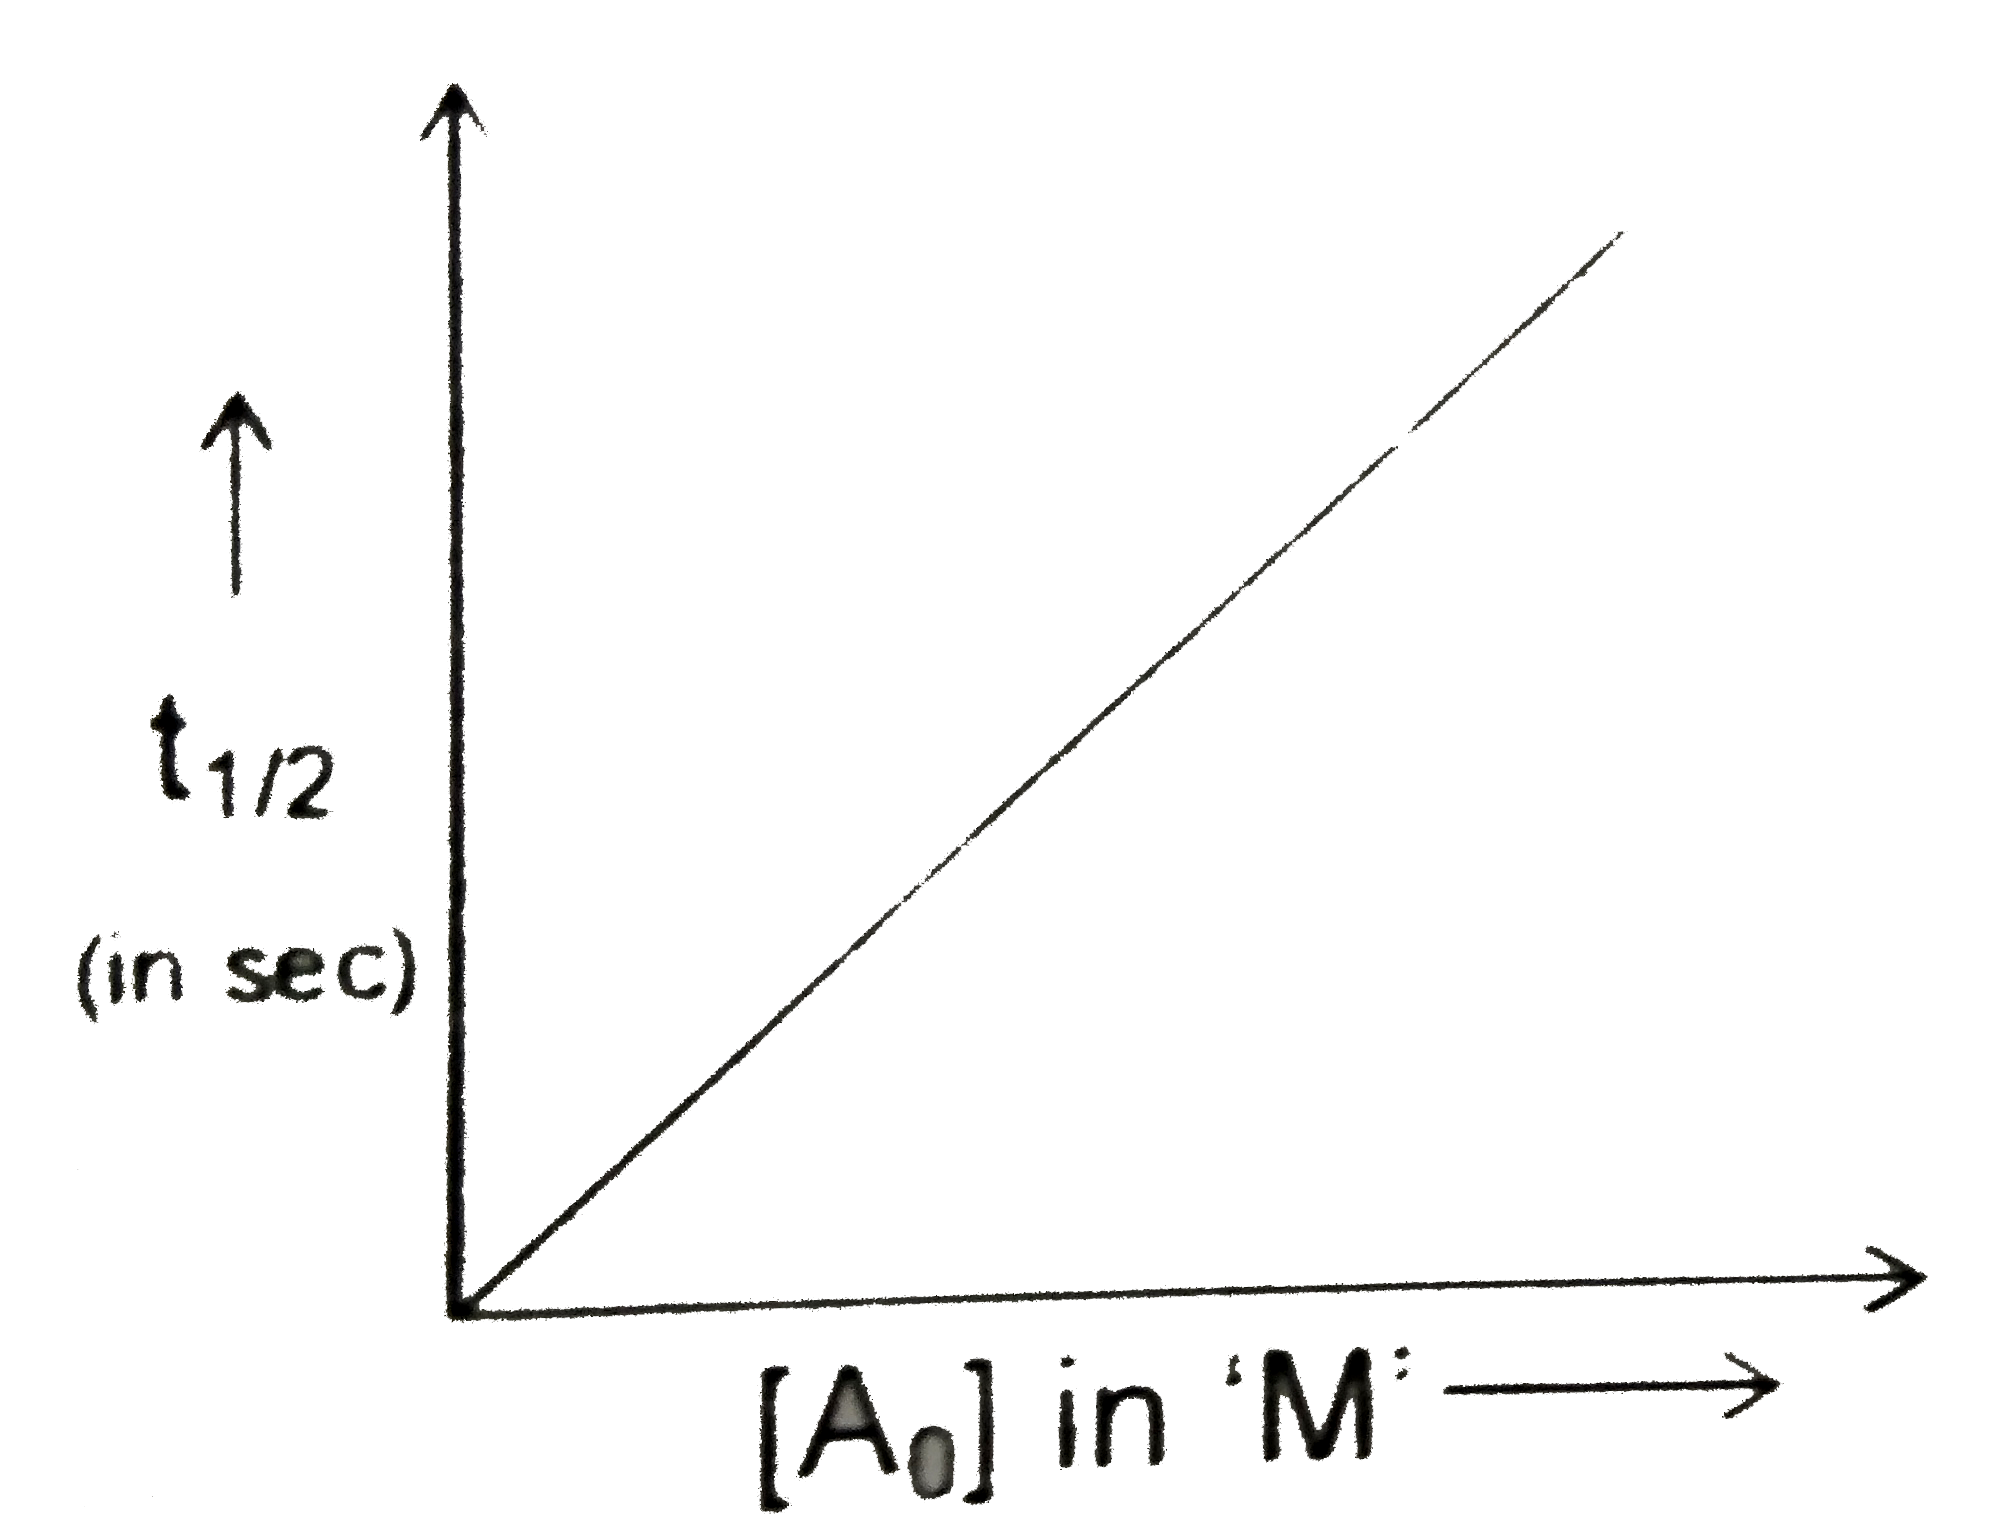
What is the unit of rate constant of the reaction for which the above graph is given?
View SolutionRead the bar graph given below :
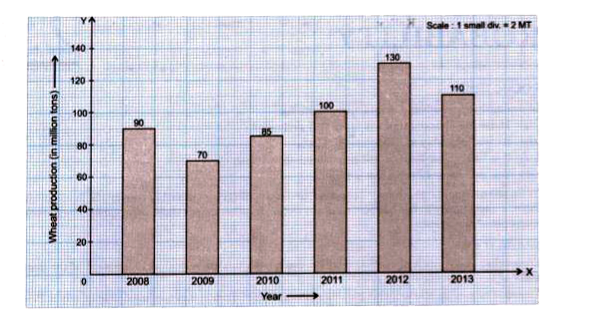
What was the wheat production in 2010?
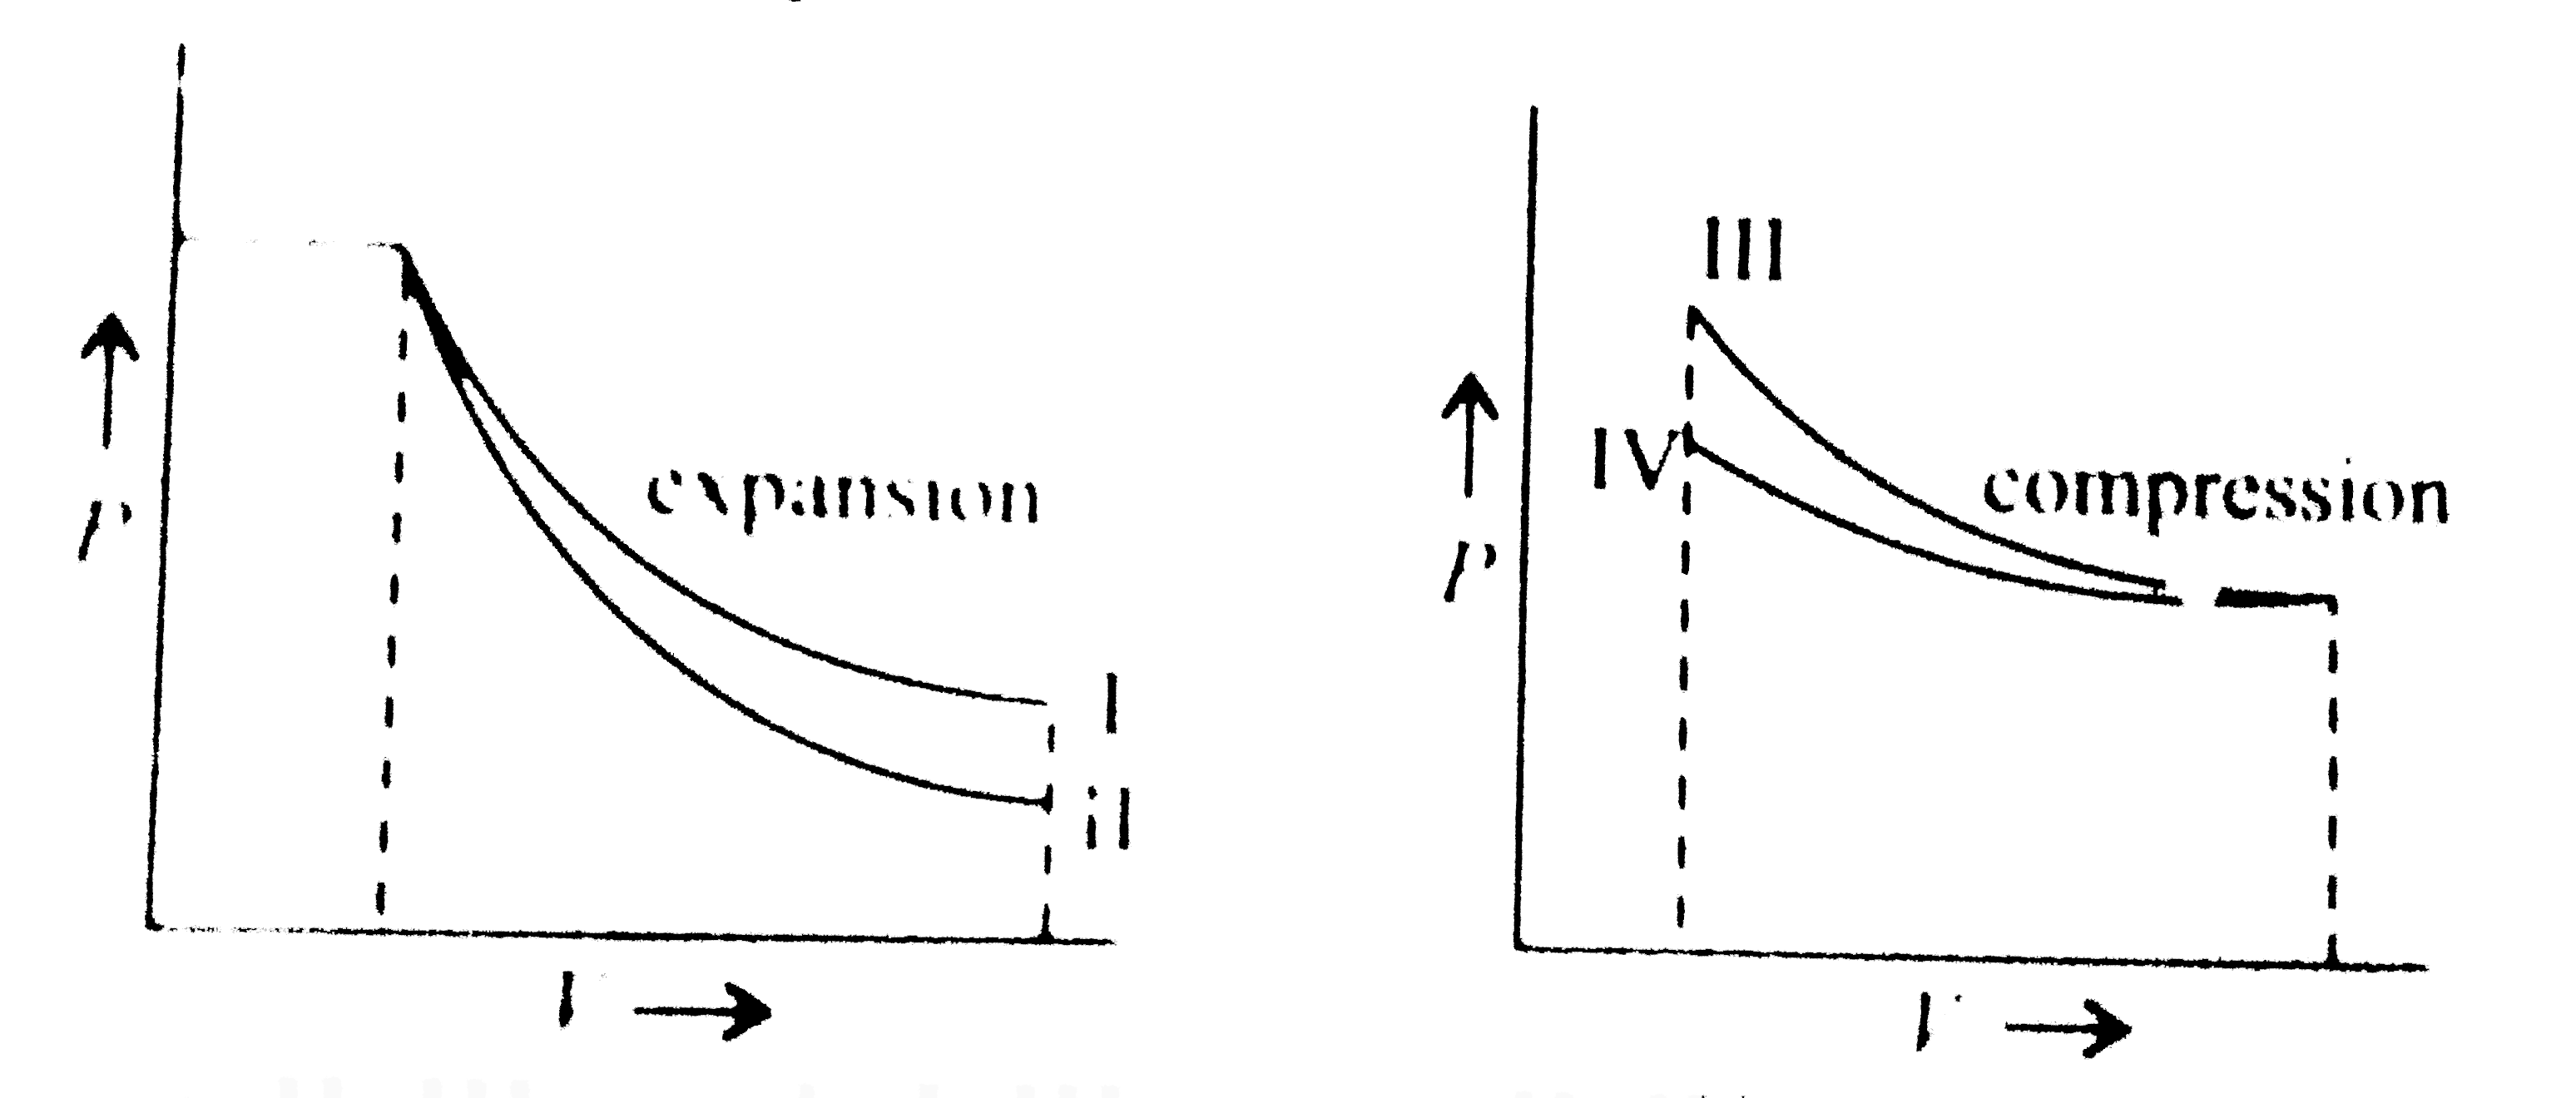
View SolutionWhich of the following graphs given below show (s) adiabatic process?
View SolutionWhich one of the given graphs shows the effect of pH on the velocity of a typical enzymatic reaction (V) ?
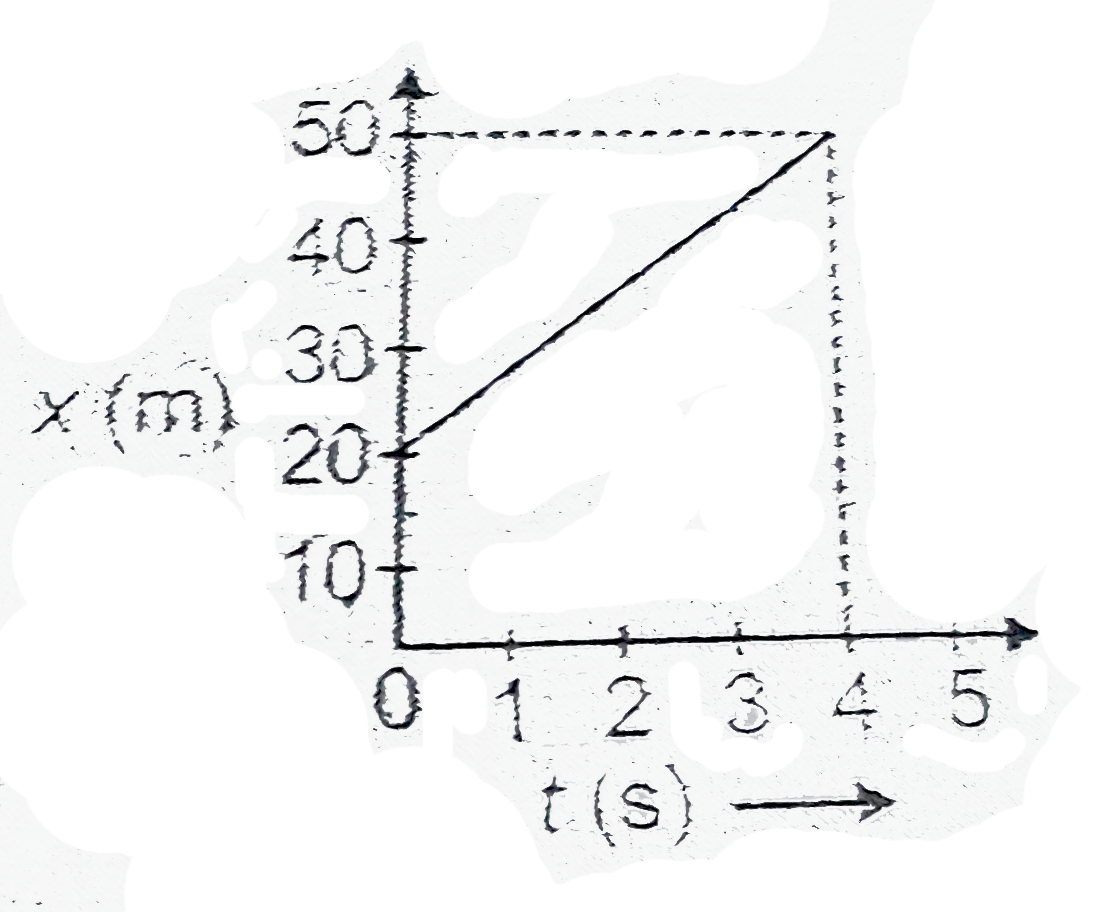
View SolutionThe position-time graph of an object is given below. What is the velocity of the object?
View Solution
