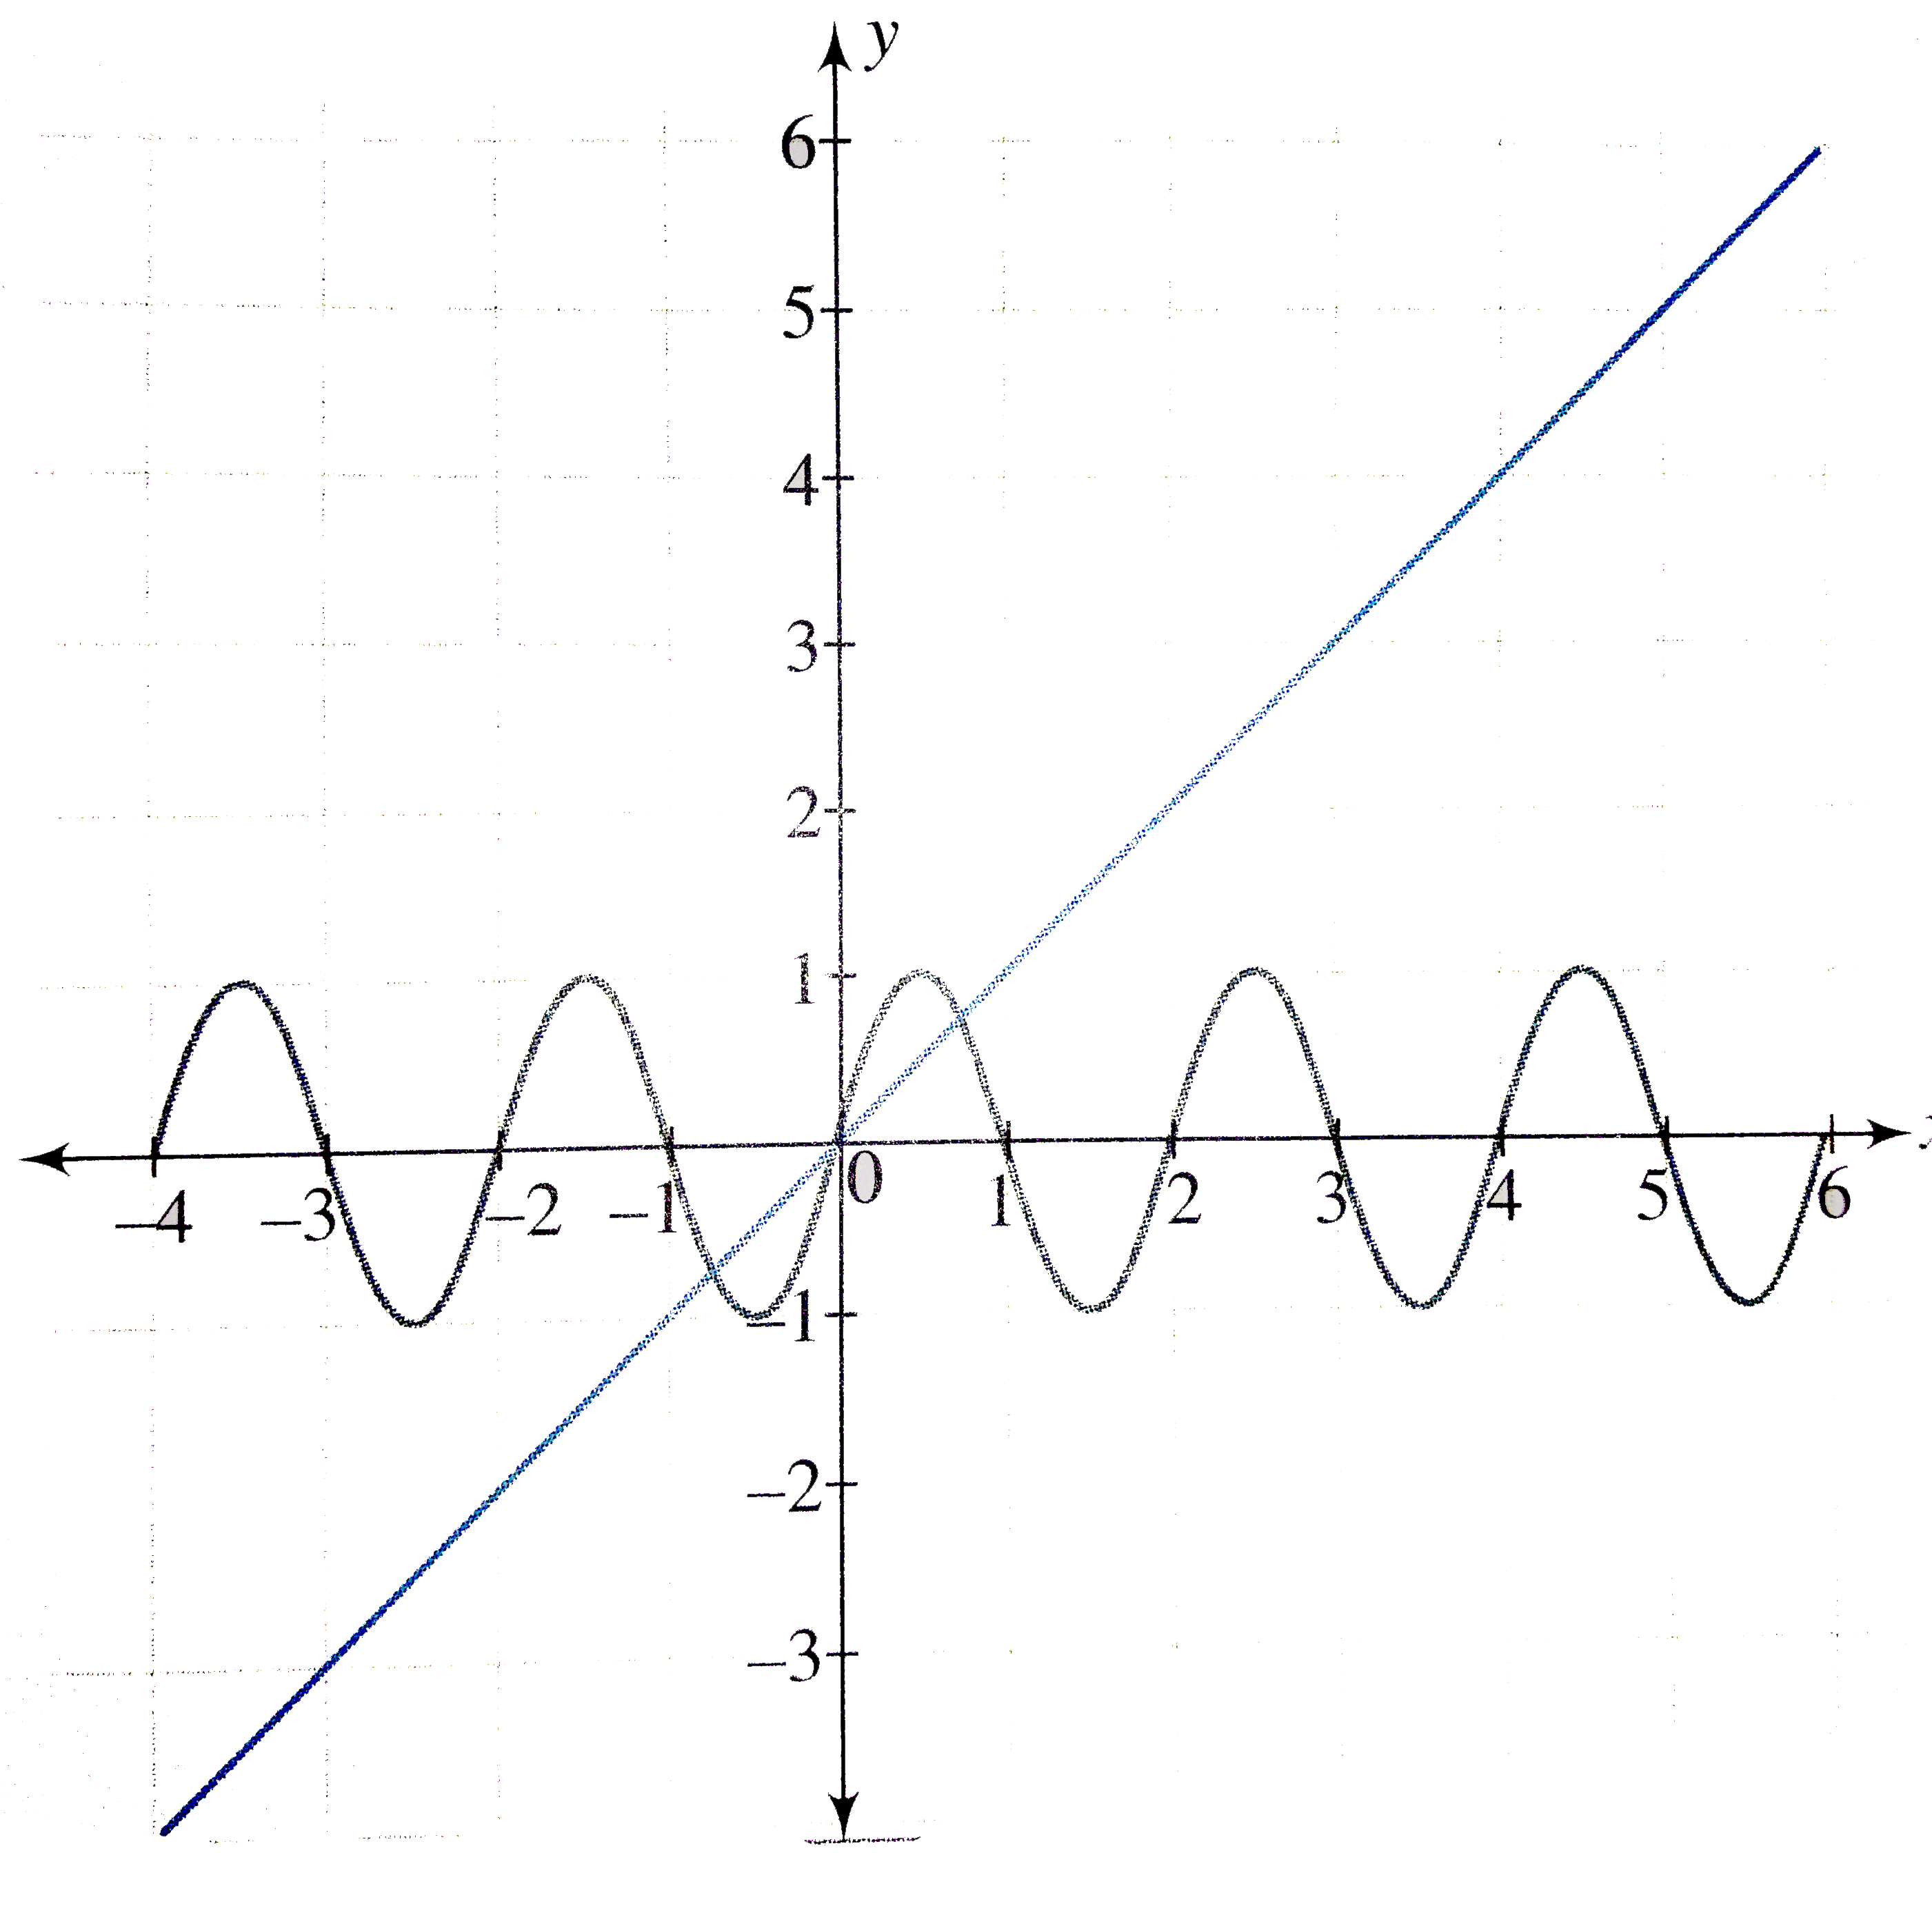
The graph of y=f(x) is as shown in the following figure. Draw the graph of y=[f(x)].
![The graph of y=f(x) is as shown in the following figure. Draw the graph of y=[f(x)].](https://d10lpgp6xz60nq.cloudfront.net/physics_images/CEN_GRA_C05_E01_021_Q01.png) Solution in Bengali
Solution in Bengali
Draw the line y=x on the given graph y=f(x).

From the figure, xf(x)>0 for x∈(−3,−2)∪(−1,0)∪(0,1)∪(2,3)∪(4,5)andxf(x)<0 for x∈(−4,−3)∪(−2,−1)∪(1,2)∪(3,4)∪(5,6)
xf(x)=0 for x=−4,−3,−2,−1,0,1,2,3,4,5,6
Thus, the graph of y=f(x)=sgn(xf(x)) is as follows.

Topper's Solved these Questions
- BOOK - CENGAGE PUBLICATIONCHAPTER - GRAPHS OF ELEMENTARY FUNCTIONS EXERCISE - EXERCISES34videos
GRAPHS OF ELEMENTARY FUNCTIONS
- BOOK - CENGAGE PUBLICATIONCHAPTER - GRAPHS OF POLYNOMIAL AND RATIONAL FUNCTIONSEXERCISE - Exercises17videos
GRAPHS OF POLYNOMIAL AND RATIONAL FUNCTIONS
- BOOK - CENGAGE PUBLICATIONCHAPTER - GRAPHS OF TRIGONOMETRIC FUNCTIONSEXERCISE - Exercises22videos
GRAPHS OF TRIGONOMETRIC FUNCTIONS
Similar Questions
Draw the graph of y=1(1/x).
02:11View SolutionDraw the graph of y=(x−1)(x2−x+1).
01:31View SolutionDraw the graph of y= cosec 2x−cot2x. Is f(x) periodic ? If yes, what is its fundamental period ?
02:45View SolutionDetermine the point of symmetry of a regular hexagon.
02:17View SolutionDtermine the images of the following figure about the given line :
05:41View SolutionMatch the following Column A to Column B
 02:10View Solution
Match the following Column A to Column B
 02:17View Solution
Match the following Column A to Column B
 02:10View Solution
The inequation represented by the graph given below is :
01:59View SolutionThe inequation that best describes the graph given below is _________
01:31View SolutionThe inequation that best describes the following graph is _________
02:57View SolutionThe equation of straight line shown in figure is :
ltimg src="https://d10lpgp6xz60nq.cloudfront.net/physics_images/ALN_PHY_R04_E01_020_Q01.png" width="80%"gt01:17View SolutionThe equation of graph shown in figure is y=2x2. The slope of graph at point P is :
ltimg src="https://d10lpgp6xz60nq.cloudfront.net/physics_images/ALN_PHY_R04_E01_023_Q01.png" width="80%"gt01:19View SolutionMagnitude of slope i.e. steepness of graph shown in figure ltimg src="https://d10lpgp6xz60nq.cloudfront.net/physics_images/ALN_PHY_R04_E01_026_Q01.png" width="80%"gt
01:06View SolutionGraph of an exponential function y=2+ae−x is shown in figure. What is the value of a ?
ltimg src="https://d10lpgp6xz60nq.cloudfront.net/physics_images/ALN_PHY_R04_E01_028_Q01.png" width="80%"gt01:56View SolutionWhat is the distance OA for the square shown in figure :- ltimg src="https://d10lpgp6xz60nq.cloudfront.net/physics_images/ALN_PHY_R05_E01_015_Q01.png" width="80%"gt
01:43View Solution

