The following data shows the amount of money each student in class VII of a school spends in school canteen in one day

Prepare a frequency distribution table
Step by step video & image solution for The following data shows the amount of money each student in class VII of a school spends in school canteen in one day Prepare a frequency distribution table by Maths experts to help you in doubts & scoring excellent marks in Class 7 exams.
Updated on:21/07/2023Topper's Solved these Questions
- DATA HANDLINGBook:MTG IIT JEE FOUNDATIONChapter:DATA HANDLINGExercise:Solved Examples
Explore 30 Videos
- DATA HANDLINGBook:MTG IIT JEE FOUNDATIONChapter:DATA HANDLINGExercise:NCERT Section (Exercise - 3 .1 )
Explore 23 Videos
- CONGRUENCE OF TRIANGLES Book:MTG IIT JEE FOUNDATIONChapter:CONGRUENCE OF TRIANGLES Exercise:Olympiad/HOTS Corner
Explore 10 Videos
- EXPONENTS AND POWERSBook:MTG IIT JEE FOUNDATIONChapter:EXPONENTS AND POWERSExercise:OLYMPIAD/HOTS CORNER
Explore 15 Videos
Similar Questions
The following table shows the interest of students of a school in different games :

Represent the data by using a simple bar diagram.
View SolutionThe following table shows the marks obtained by 100 students of Class X in a school during a particular academic session. Find the mode of this distribution.
View Solution
Knowledge Check
The following pictograph shows different using conveyance by the students of a school:
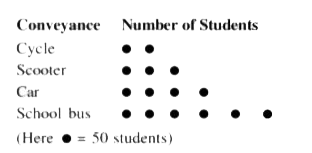
What per cent of students used school bus?A0.06B0.16C0.4D0.36The following bar graph shows the number of students in a particular class of school. Then, answer the following questions.
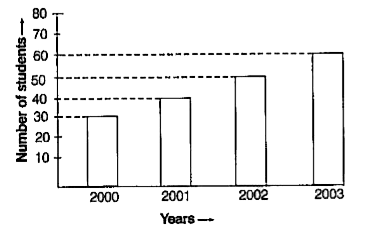
What is the number of students in the year 2003?A10B25C45D60The following bar graph shows the number of students in a particular class of school. Then, answer the following questions.
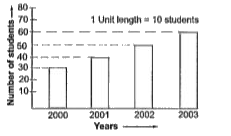
(i) What is the nuber of students in the year 2003 ?A70B60C50D40
The following table show tha cumulative frequency distribution of marks of 800 students in an examination.
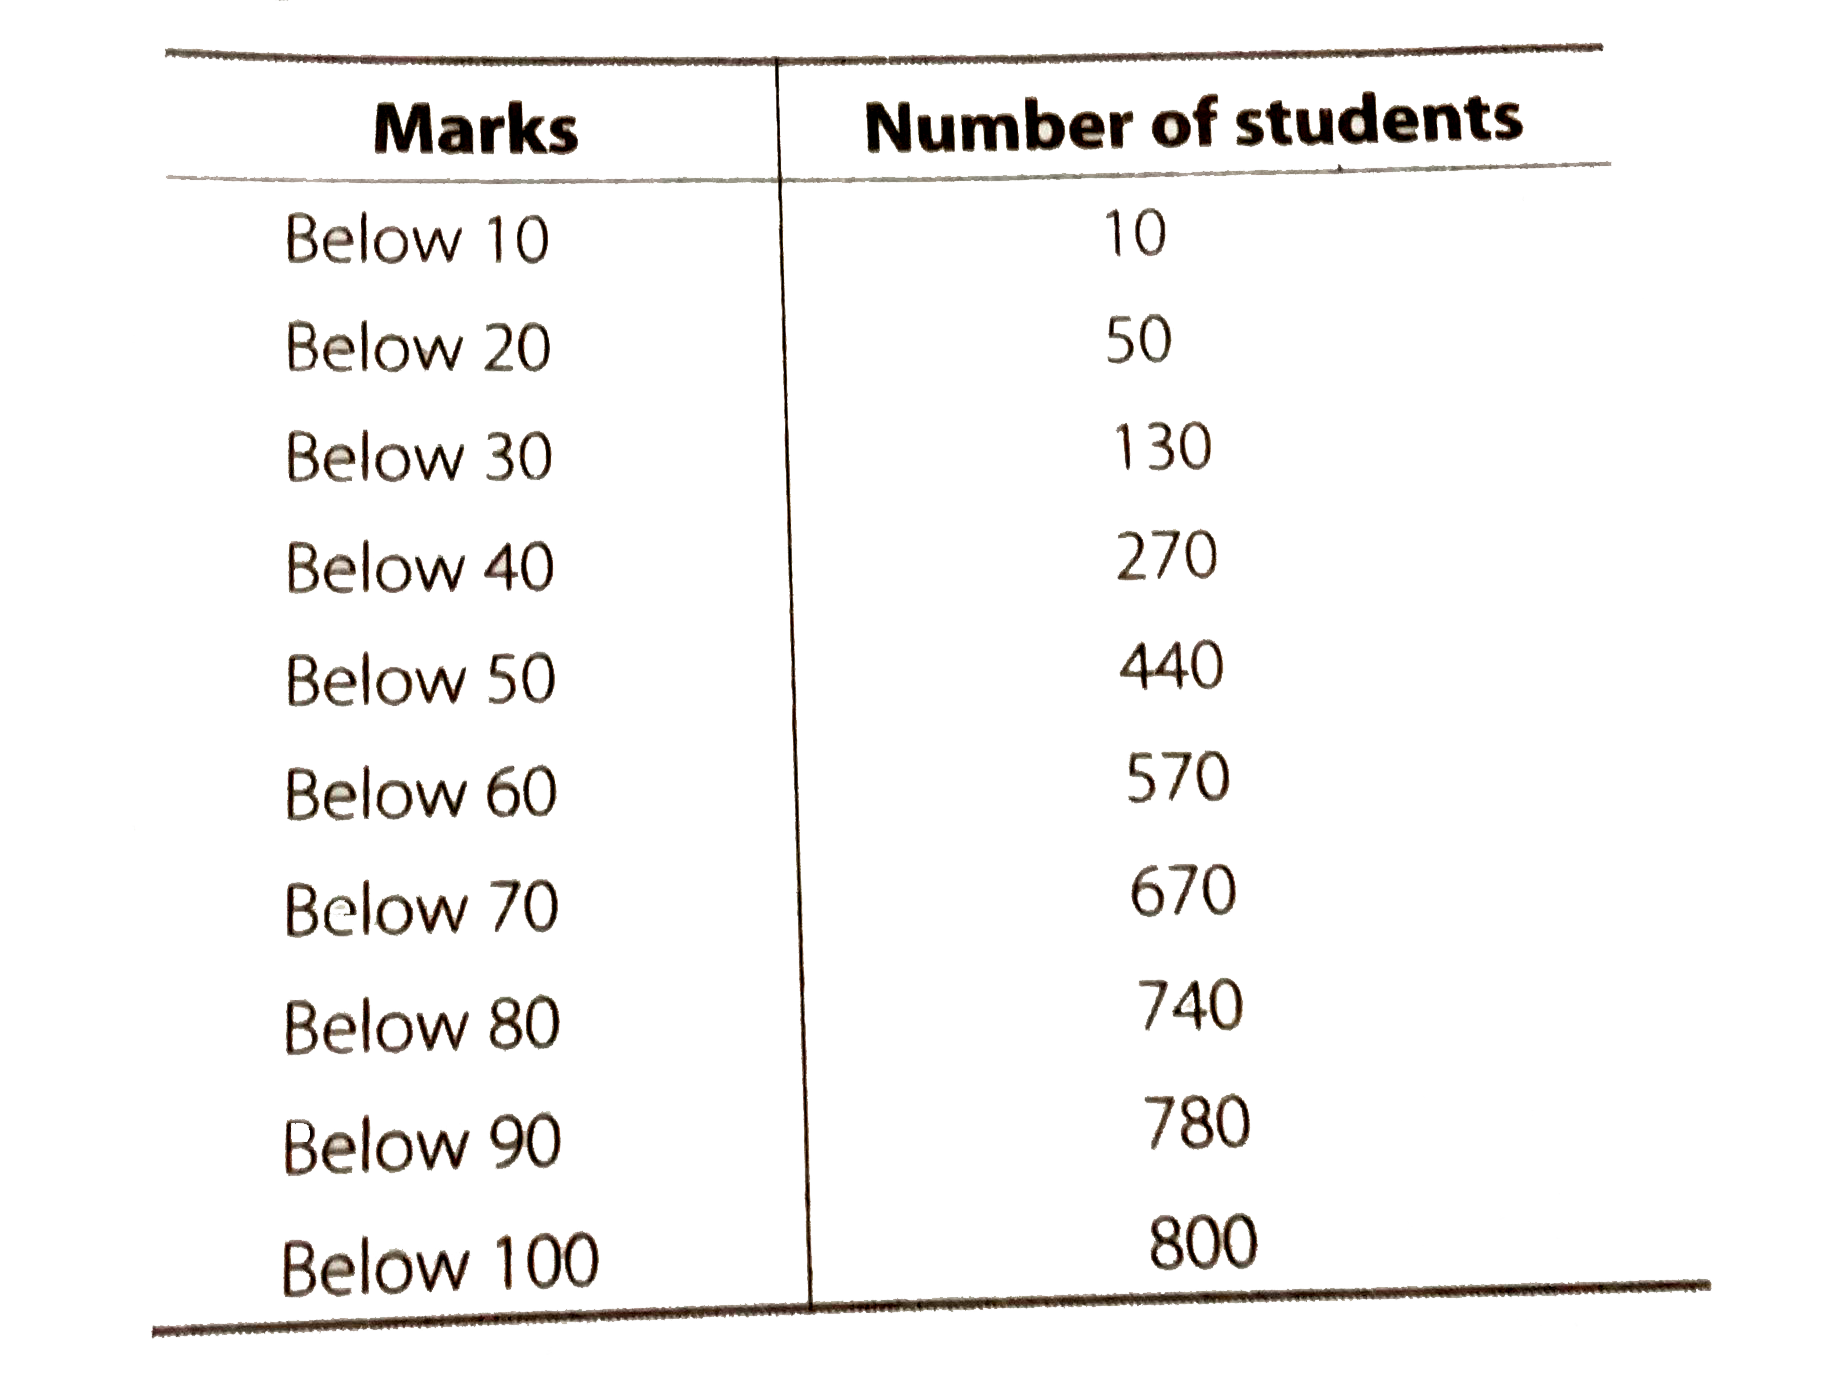
Construct a frequency distribution table for the data above.
View SolutionThe following table shows the marks obtained by 100 students of a class in a school during a particular academic session. Find the modal marks.

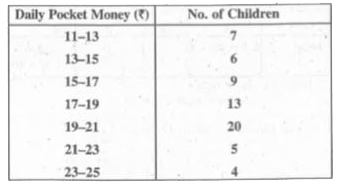
View SolutionThe following distribution shows the daily pocket money of children of a school.
Find the average daily pocket money of children.
View SolutionThe following bar graph shows the number of students in different classes of a school.
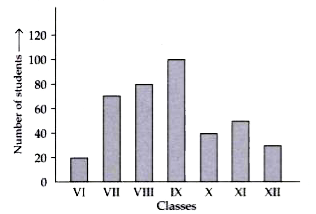
How many more students are there in Class IX than in Class VIII ?
View SolutionThe following table given the age of 500 students in a school. Calculate the average age:

View Solution