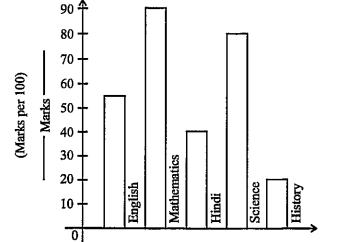
Study the bar graph given below and answer the questions that follow
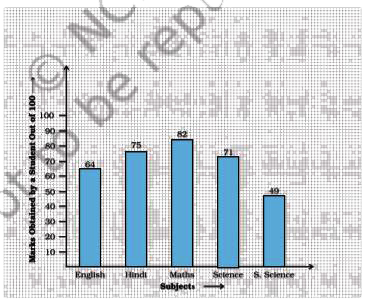
(a) What information is depicted from the bar graph?
(b) In which subject is the student very good?
(c) Calculate the average marks of the student.
(d) If 75 and above marks denote a distinction, then name the subjects in which the student got distinction.
(e) Calculate the percentage of marks the student got out of 500.
Step by step video & image solution for Study the bar graph given below and answer the questions that follow (a) What information is depicted from the bar graph? (b) In which subject is the student very good? (c) Calculate the average marks of the student. (d) If 75 and above marks denote a distinction, then name the subjects in which the student got distinction. (e) Calculate the percentage of marks the student got out of 500. by Maths experts to help you in doubts & scoring excellent marks in Class 7 exams.
Updated on:21/07/2023Topper's Solved these Questions
- DATA HANDLINGBook:NCERT EXEMPLARChapter:DATA HANDLINGExercise:THINK AND DISCUSS
Explore 3 Videos
- DATA HANDLINGBook:NCERT EXEMPLARChapter:DATA HANDLINGExercise:EXERCISE(TRUE OR FALSE)
Explore 18 Videos
- COMPARING QUANTITIESBook:NCERT EXEMPLARChapter:COMPARING QUANTITIESExercise:THINK AND DISCUSS
Explore 24 Videos
- EXPONENTS AND POWERSBook:NCERT EXEMPLARChapter:EXPONENTS AND POWERSExercise:EXERCISE
Explore 136 Videos
Similar Questions
Look at the bar graph given below
Read it carefully and answer the following questions
Q(i) What information does the bar graph give
(ii) In which subject is the student very good
(iii) In which subject is he poor
(iv) What is the average of his marks
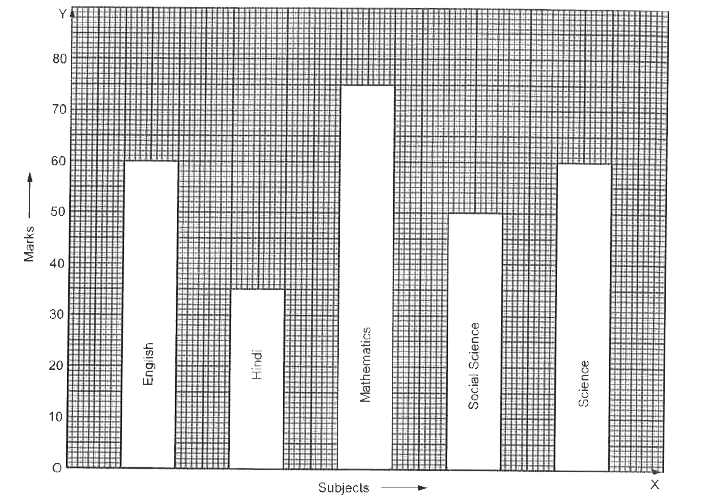
View SolutionLook at the bar graph given below.
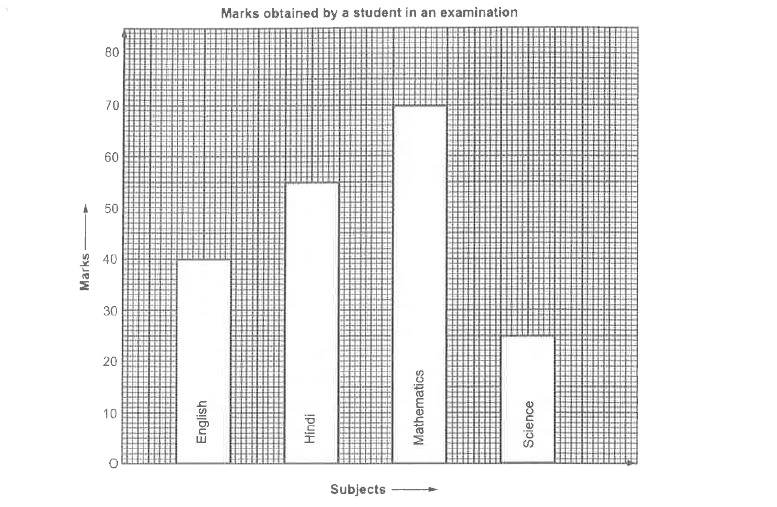
Read if cerefully and answer the questions given below:
What information does the bar graph give ?
In which subject is the student poorest ?
In which subject is the student best ?
In which subjects did he get more than 40 marks ?
View Solution
Knowledge Check
Study the double bar graph given below and answer the questions.
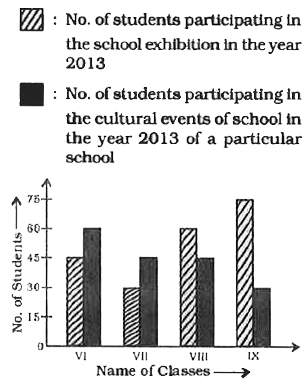
The average of the number of students participating in cultural events isA48.75B52.5C45D50Study the double bar graph given below and answer the questions.
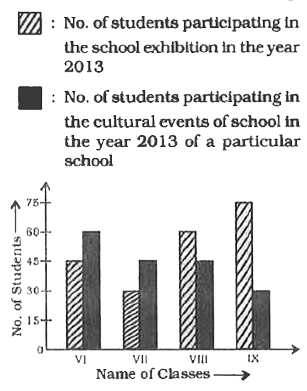
The average of the number of students participating in exhibition isA48.75B52.5C45D50What is the average of marks obtained by all the students in subject B?
A71.4B73.14C107.14D114.07
Read the bar graph given below and answer the following questions:
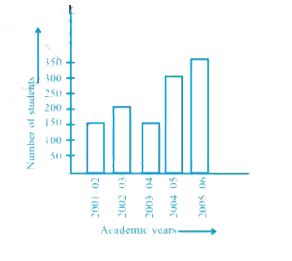
In which year is the number of students maximum?
View SolutionRead the bar graph given below and answer the following questions:
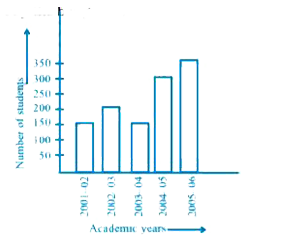
In which year is the number of students twice as that of 2001-02?
View Solution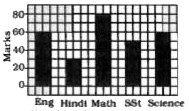
The above bar graph show the marks obtained by a students in an examination. What is the average marks obtained by the student ?
View SolutionRead the following graph and answer the questions given below-:
In which subject is the student poor?
View SolutionRead the following graph and answer the questions given below
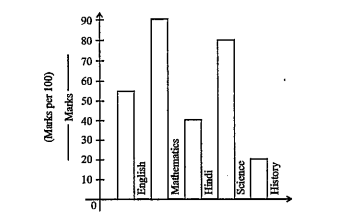
average marks obtained by the student is
View Solution