Answer the following questions:
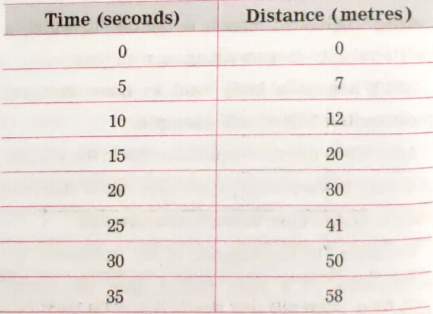
The following table shows the distances covered by a bus in equal time intervals. Draw a graph of distance against time taking the time along the X-axis and distance along Y-axis. Does the graph show a direct proportionality between distance and time?
 Solution in Marathi
Step by step video & image solution for Answer the following questions: The following table shows the distances covered by a bus in equal time intervals. Draw a graph of distance against time taking the time along the X-axis and distance along Y-axis. Does the graph show a direct proportionality between distance and time? by Physics experts to help you in doubts & scoring excellent marks in Class 9 exams.
Updated on:21/07/2023Topper's Solved these Questions
- LAWS OF MOTIONBOOK - NAVNEET PUBLICATIONCHAPTER - LAWS OF MOTIONEXERCISE - EXERCISE
196 Videos
- CURRENT ELECTRICITYBOOK - NAVNEET PUBLICATIONCHAPTER - CURRENT ELECTRICITYEXERCISE - EXERCISE
215 Videos
- MEASUREMENT OF MATTERBOOK - NAVNEET PUBLICATIONCHAPTER - MEASUREMENT OF MATTEREXERCISE - EXAMPLES
1 Videos
Similar Questions
Complete the sentences and explain them:
The minimum distance between the start and finish points of the motion of an object is called the ........ of the object.
View SolutionFill in the blanks:
The coulomb is the SI unit of………….
View SolutionWhat is the Dalton's atomic theory?
View Solution(a) The distance time graph of a body is parallel to the time axis. What does it indicate ? (b) The distance time graph of a body coincide with time axis. What does it indicate ?
View SolutionThe graph between the object distance along the X-axis and image distance along Y-axis for a convex lens is
View SolutionThe distance travelled by a body in different time intervals is tabulated as follows . Draw the distance time graphs.
View Solutionदिखाइए कि एकसमान त्वरण में किसी सरल रेखा के अनुदिश गतिशील वस्तु के समय-वेग ग्राफ एवं समय-अक्ष के बीच घिरे क्षेत्र का क्षेत्रफल उस अन्तराल में वस्तु द्वारा तय की गयी दूरी के बराबर होता है ।
View Solutionकिसी गतिमान पिंड के दूरी-समय ग्राफ के ढाल से पता चलता है :
View SolutionShows the curve of the distance time graph
View SolutionShow that the area under the velocity-time graph of an object moving with constant acceleration in a straight line in certain time interval is equal to the distance covered by the object in that interval.
View SolutionShow that area under the velocity-time graph of an object moving with constant acceleration in a straight line in certain time interval is equal to the distance covered by the object in the interval.
View SolutionDistance covered-time graph cannot be
View Solutionएक कार द्वारा चली गईं दूरी तथा इस दूरी को तय करने में लगा समय सारणी में दिए गए हैं। इससे दूरी-समय ग्राफ खींचिए।

View Solutionएक रेलगाड़ी द्वारा तय की गई दूरी तथा इस दूरी को तय करने में लगा समय दिया गया है । इन आँकड़ों के आधार पर दूरी-समय आलेख खींचिए |

View SolutionThe distances travelled by a car at various time intervals are as follows : Draw a distance-time graph for the car.
View Solution
