किसी कारखाना के विभिन्न विभागों में कार्यरत कर्मचारियों की संख्या
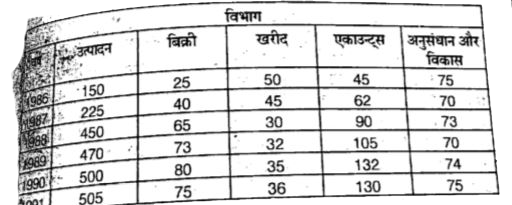
किस वर्ष प्रत्येक विभाग में ठीक पिछले वर्ष की तुलना में कर्मचारियों की संख्या अधिक थी ?
Step by step video & image solution for किसी कारखाना के विभिन्न विभागों में कार्यरत कर्मचारियों की संख्या किस वर्ष प्रत्येक विभाग में ठीक पिछले वर्ष की तुलना में कर्मचारियों की संख्या अधिक थी ? by Maths experts to help you in doubts & scoring excellent marks in Class 14 exams.
Updated on:21/07/2023Topper's Solved these Questions
- सारणीकरण BOOK - MAHESH MISHRACHAPTER - सारणीकरण EXERCISE - प्रतियोगी परीक्षाओ में पूछे गए प्रश्न
52 Videos
- सारणीकरण BOOK - MAHESH MISHRACHAPTER - सारणीकरण EXERCISE - प्रतियोगी परीक्षाओ हेतु अभ्यास प्रश्नमाला
73 Videos
- साधारण ब्याज BOOK - MAHESH MISHRACHAPTER - साधारण ब्याज EXERCISE - 9C प्रतियोगी परीक्षाओ में पूछे गए प्रश्न
65 Videos
Similar Questions
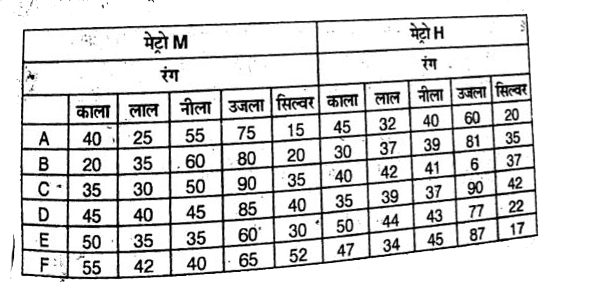
दोनों मेट्रो शहरो में किस नमूना के उजले रंग के कारो की बेचीं गयी संख्याओं में अंतर न्यूनतम है ?
View Solutionनिम्नलिखित प्रत्येक सरणी को पढ़िए और उसके नीचे दिए गए प्रश्नो का उत्तर दीजिये।
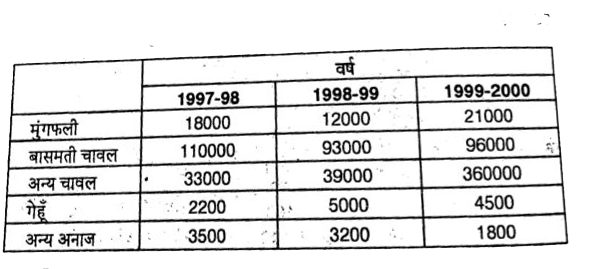
किस भोज्य उत्पाद का निर्यात पहले दो लगातार वर्षो में उसके कुल निर्यात के दो गुना से भी अधिक है ?
View Solution400 रु. को राशि पर 5% वार्षिक दर से 73 दिनों का साधारण ब्याज क्या होगा ?
View SolutionDetermine the point of symmetry of a regular hexagon.
View SolutionMatch the following Column A to Column B

View SolutionMatch the following Column A to Column B

View SolutionMatch the following Column A to Column B

View SolutionThe inequation represented by the graph given below is :
View SolutionThe inequation that best describes the graph given below is _________
View SolutionThe inequation that best describes the following graph is _________
View SolutionThe given table shows the number (in percent) of employees working in different depratments of an organization. The table also shows the ratio of males and females and the ratio of employees living in city Z and employees , living in city Y. The total number of employees in the organization 80,000.
दी गई तालिका में एक संगठन के विभिन्न विभागों में कार्य कर रहे कर्मचारियों की संख्या ( प्रतिशत में ) को दर्शाया गया है। यह तालिका पुरूषों तथा महिलाओं के अनुपाव को तथा शहर ,Z में रह रहे कर्मचारियों तथा शहर Y में रह रहे कर्मचारियों के अनुपात को भी दर्शाती है। संगठन रद में कुल कर्मचारियों की संख्या 80000 है।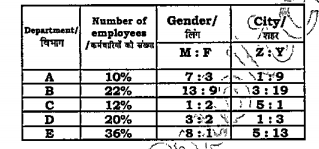 How many employees of department A and C together are living in city Z?
विभाग A तथा C के कितने कर्मचारी, शहर Z में साथ-मिलकर रह रहें है?
View SolutionThe given table shows the number (in percent) of employees working in different depratments of an organization. The table also shows the ratio of males and females and the ratio of employees living in city Z and employees , living in city Y. The total number of employees in the organization 80,000.
दी गई तालिका में एक संगठन के विभिन्न विभागों में कार्य कर रहे कर्मचारियों की संख्या ( प्रतिशत में ) को दर्शाया गया है। यह तालिका पुरूषों तथा महिलाओं के अनुपाव को तथा शहर ,Z में रह रहे कर्मचारियों तथा शहर Y में रह रहे कर्मचारियों के अनुपात को भी दर्शाती है। संगठन रद में कुल कर्मचारियों की संख्या 80000 है।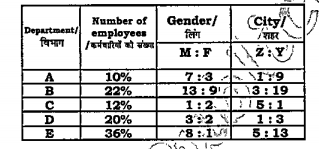 On an average how many residents of city Y are working in each department?
शहर Y के कितने निवासी औसतन एक विभाग में कार्य कर रहे है?
View SolutionThe given table shows the number (in percent) of employees working in different depratments of an organization. The table also shows the ratio of males and females and the ratio of employees living in city Z and employees , living in city Y. The total number of employees in the organization 80,000.
दी गई तालिका में एक संगठन के विभिन्न विभागों में कार्य कर रहे कर्मचारियों की संख्या ( प्रतिशत में ) को दर्शाया गया है। यह तालिका पुरूषों तथा महिलाओं के अनुपाव को तथा शहर ,Z में रह रहे कर्मचारियों तथा शहर Y में रह रहे कर्मचारियों के अनुपात को भी दर्शाती है। संगठन रद में कुल कर्मचारियों की संख्या 80000 है।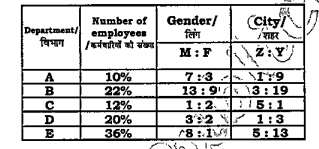 what are the total number of employee in department A and E together?
विभाग A तथा E में मिलाकर कुल कर्मचारियों की संख्या क्या है?
View SolutionThe given Bar Graph presents the number of students of two schools for six years. दिया गया दंड आरेख छः वर्ष की अवधि में दो विद्यालयों में छात्रों की संख्या को दर्शाता है | In which year, the absolute difference between the numbers of students in two schools is the highest? किस वर्ष में, दोनों विद्यालयों में छात्रों की संख्या के बीच पूर्ण अंतर सबसे अधिक है ?
View SolutionThe given Bar Graph presents the number of students of two schools for six years. दिया गया दंड आरेख छः वर्ष की अवधि में दो विद्यालयों में छात्रों की संख्या को दर्शाता है | In which year, the percentage increase in students in school B is the highest in comparison to its previous year? किस वर्ष में, विद्यालय B में छात्रों की संख्या में प्रतिशत वृद्धि इसके पिछले वर्ष की तुलना में सबसे अधिक रही है?
View SolutionThe given Bar Graph presents the number of students of two schools for six years. दिया गया दंड आरेख छः वर्ष की अवधि में दो विद्यालयों में छात्रों की संख्या को दर्शाता है | In which year, the percentage increase of students in school A is the highest in comparison to its previous year? किस वर्ष, विद्यालय A में छात्रों की संख्या में प्रतिशत वृद्धि पिछले वर्ष की तुलना में सर्वाधिक है ?
View Solution
