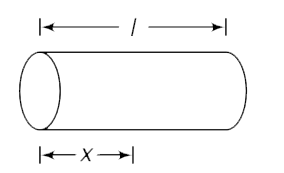
A cylindrical conductor has uniform cross-section. Resistivity of its material increase linearly from left end to right end. If a constant current is flowing through it and at a section distance x from left end, magnitude of electric field intensity is E , which of the following graphs is correct
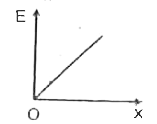
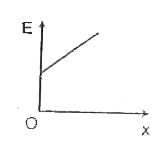
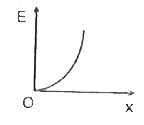
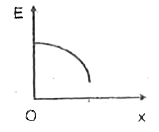
The correct Answer is:B
To solve the problem, we need to analyze the relationship between the electric field intensity E and the distance x from the left end of the cylindrical conductor, given that the resistivity ρ increases linearly along the length of the conductor.
1. Understanding Resistivity Variation:
The resistivity ρ of the material increases linearly from the left end to the right end. We can express this mathematically as:
ρ(x)=ρ0+αx
where ρ0 is the resistivity at the left end (at x=0), α is a constant that describes how resistivity changes with distance, and x is the distance from the left end.
2. Using Ohm's Law:
The electric field intensity E in a conductor is related to the current I, resistivity ρ, and the cross-sectional area A by the formula:
E=I⋅ρA
Since ρ varies with x, we can substitute our expression for ρ(x) into this equation:
E(x)=I⋅(ρ0+αx)A
3. Simplifying the Expression:
We can separate the terms in the equation:
E(x)=I⋅ρ0A+I⋅αAx
Here, I⋅ρ0A is the y-intercept of the graph, and I⋅αA is the slope of the line.
4. Graph Interpretation:
The equation E(x)=mx+c indicates that the graph of E versus x will be a straight line with:
- A positive slope m=I⋅αA
- A y-intercept c=I⋅ρ0A
5. Conclusion:
Since the resistivity increases linearly, the electric field intensity E will also increase linearly with x. Therefore, the correct graph will be a straight line starting from a positive y-intercept and increasing as x increases.
Correct Graph:
Among the options provided, the graph that represents a straight line with a positive slope and a positive y-intercept is option B.
The resistivity ρ of the material increases linearly from the left end to the right end. We can express this mathematically as:
ρ(x)=ρ0+αx
where ρ0 is the resistivity at the left end (at x=0), α is a constant that describes how resistivity changes with distance, and x is the distance from the left end.
The electric field intensity E in a conductor is related to the current I, resistivity ρ, and the cross-sectional area A by the formula:
E=I⋅ρA
Since ρ varies with x, we can substitute our expression for ρ(x) into this equation:
E(x)=I⋅(ρ0+αx)A
We can separate the terms in the equation:
E(x)=I⋅ρ0A+I⋅αAx
Here, I⋅ρ0A is the y-intercept of the graph, and I⋅αA is the slope of the line.
The equation E(x)=mx+c indicates that the graph of E versus x will be a straight line with:
- A positive slope m=I⋅αA
- A y-intercept c=I⋅ρ0A
Since the resistivity increases linearly, the electric field intensity E will also increase linearly with x. Therefore, the correct graph will be a straight line starting from a positive y-intercept and increasing as x increases.
Among the options provided, the graph that represents a straight line with a positive slope and a positive y-intercept is option B.
Similar Questions
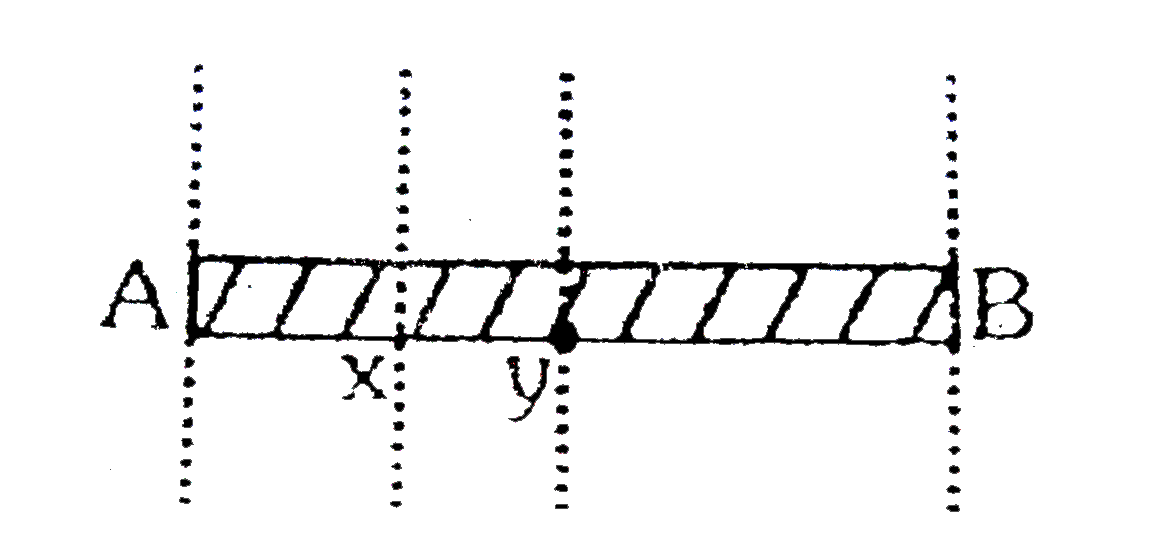
A rod has non uniform mass distribution. The mass increases uniformly from left end (A) to right end (B). It is most difficult to rotate the rod about as axis
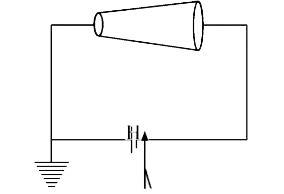
View SolutionA conductor is made of an isotropic material and has shape of a truncated cone. A battery of constant emf is connected across it and its left end is earthed as shown. If at a certain section at a distance x form left end, electric field intensity and the rate of generation of heat per unit length are E and H respectively, which of the following graphs is (are) correct?
View SolutionE denotes electric field in a uniform conductor, I corresponding current through it, vd velocity of electrons and P denotes thermal power produced in the conductor, then which of the following graph is correct?
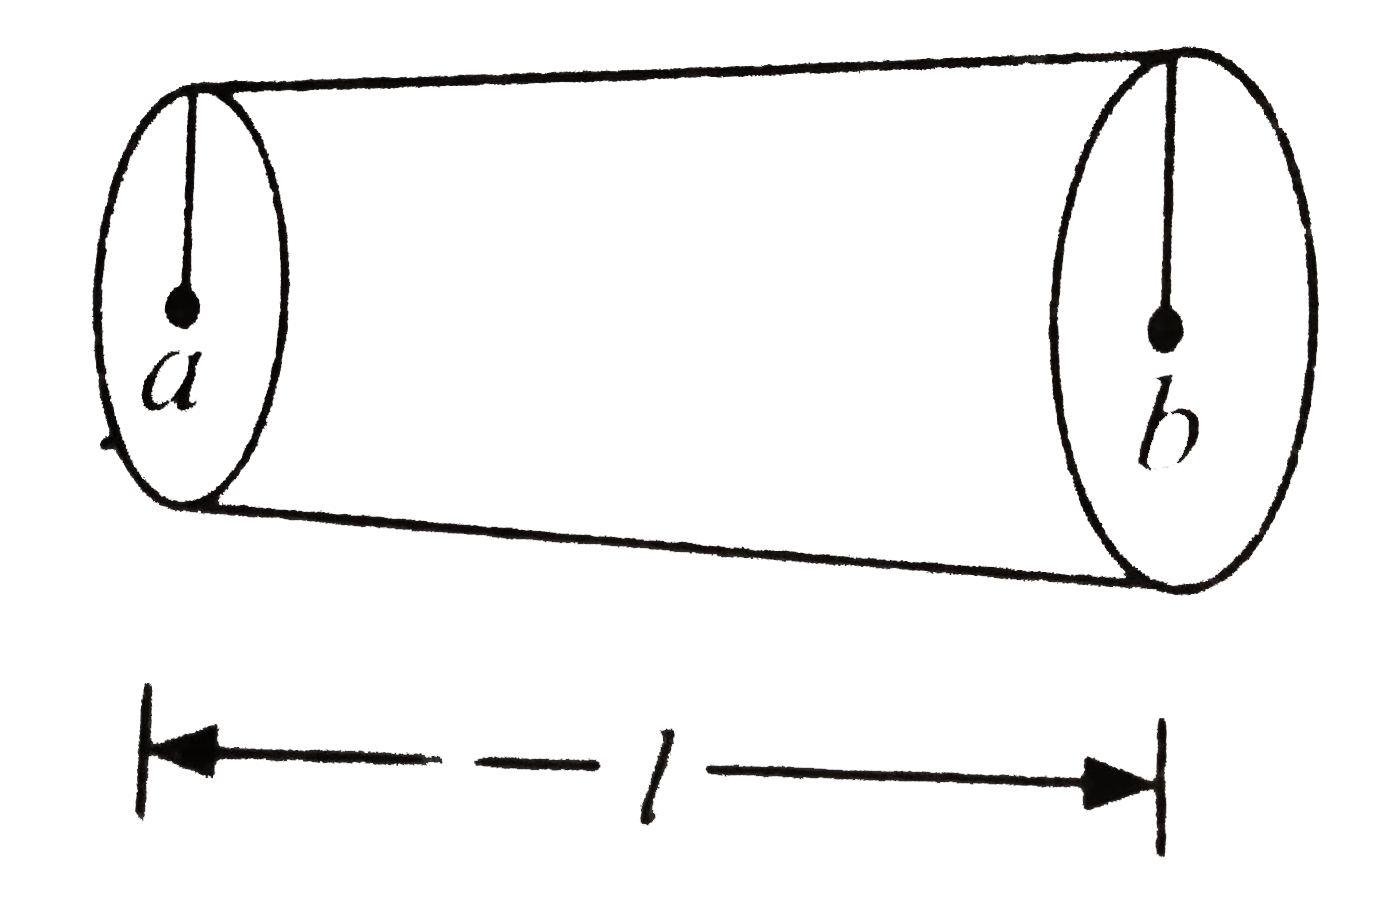
View SolutionA conductor of length l has a non-uniform cross-section. The radius of cross-section varies linearly from a to b. The resistivity of the material is ρ. Find the resistance of the conductc across its ends.
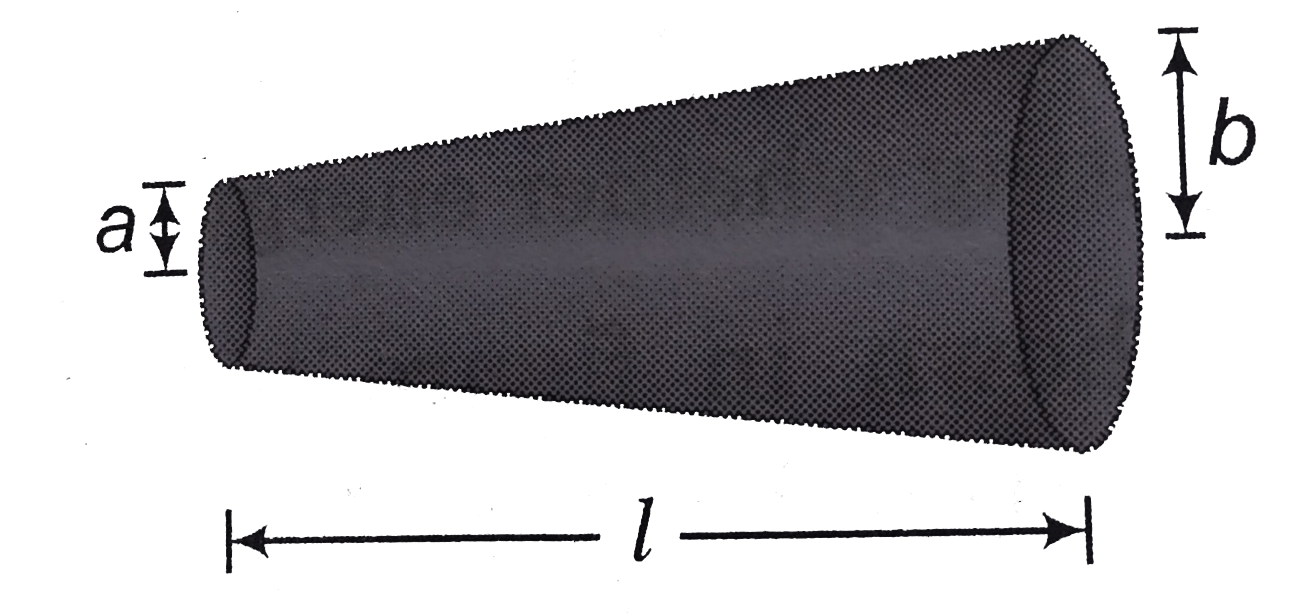
View SolutionA rod of length L is of non uniform cross-section. Its mass per unit length varies linearly with distance from left end. Then its centre of mass from left end is at a distance. (Take linear density at left end=0).
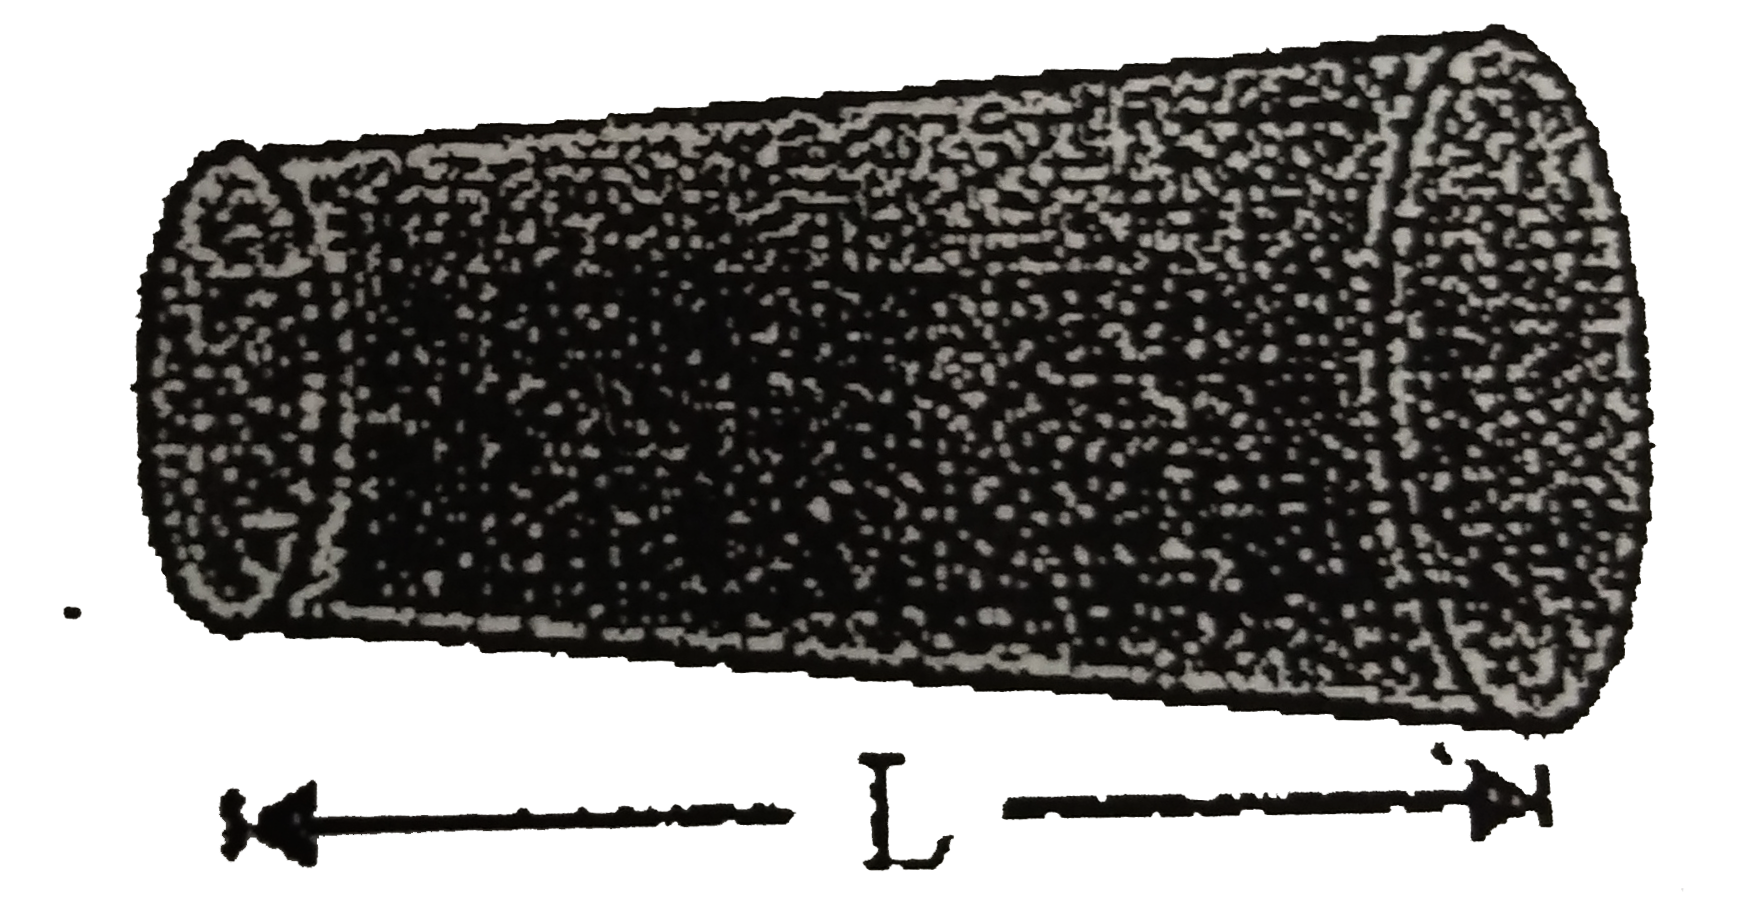
View SolutionA conductor of length L is placed along the x - axis , with one of its ends at x = 0 and the other at x = L. If the rate of flow of heat energy through the conduct is constant and its thermal resistance per unit length is also constant , then Which of the following graphs is/are correct ?
View SolutionTwo cylindrical conductors with equal cross-sections and different resistivites ρ1 and ρ2 are point end to end. Find the charge at the boundary of the conduction if a current I flows from conductor 1 to conductor 2
View SolutionA cylindrical conductor has length l and area of cross section A. Its conductivity changes with distance (x) from one of its ends as σ=σ0lx.[σ0is a constant]. Calculate electric field inside the conductor as a function of x, when a cell of emf V is connected across the ends.
View SolutionA conductor of resistivity ρ and resistance R, as shown in the figure, is connected across a battery of emf V. Its radius varies from a at left end to b at right end. The electric field at a point P at distance x from left end of it is
View SolutionA uniform rod of length l is being rotated in a horizontal plane with a constant angular speed about an axis passing through one of its ends. If the tension generated in the rod due to rotation is T(x) at a distance x from the axis. Then which of the following graphs depicts it most closely?
View Solution