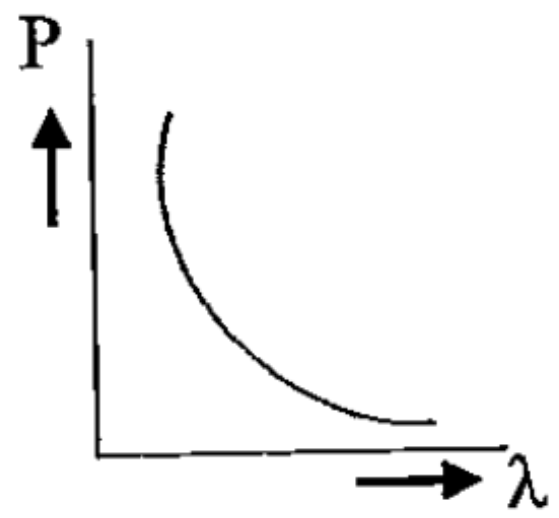
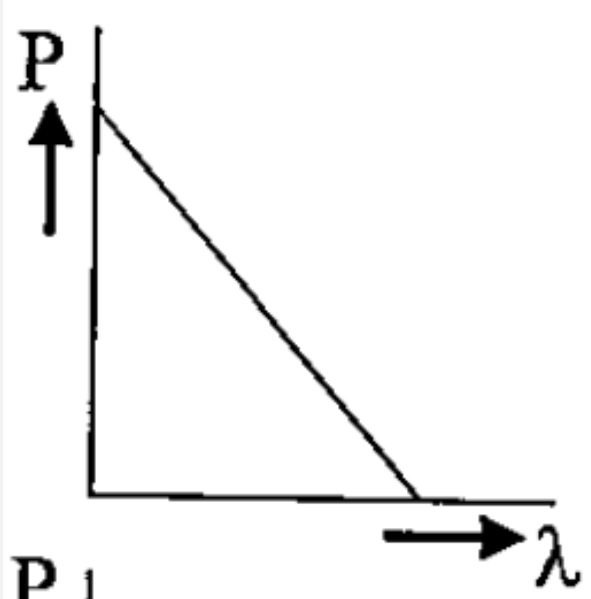
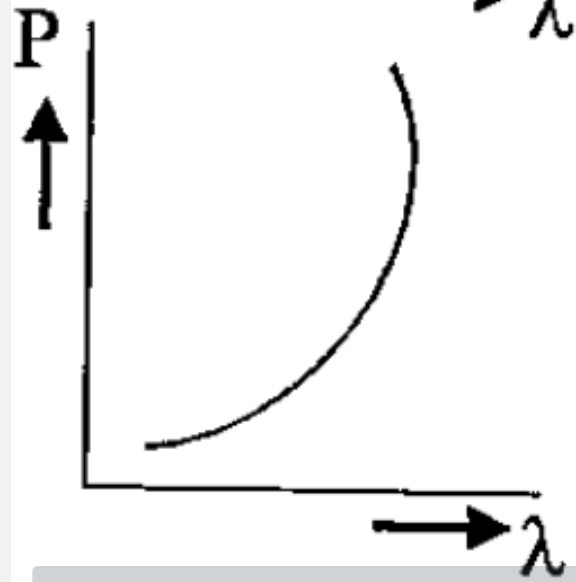
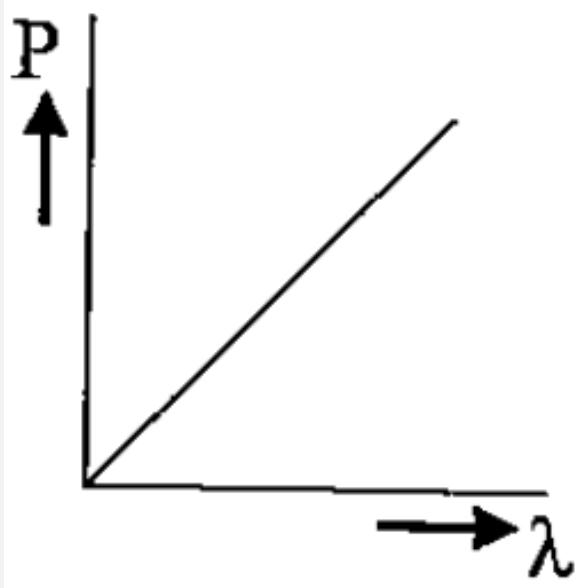
Which of the following figures represent the variation of particle momentum and the associated de-Broglie wavelength?Solution in Tamil


Step by step video & image solution for Which of the following figures represent the variation of particle momentum and the associated de-Broglie wavelength? by Physics experts to help you in doubts & scoring excellent marks in Class 12 exams.
Updated on:21/07/2023Topper's Solved these Questions
Similar Questions
A car moves from X to Y with a uniform speed νu and returns to Y with a uniform speed νd .The average speed for this round trip is:
View SolutionA charged paticle (charge q ) is moving in a circle of radius R with uniform speed V . The associated magentic moment is given by
View SolutionWhich of the following graphs correctly represents the variation of particle momentum with associated de Broglie wavelength?
View SolutionWhich of the following figure represents the variation of particle momentum and the associated de - Broglie wavelength ?
View SolutionWhich of following graphs correctly represents the variation of particle momentum with de-Broglie wavelength?
View SolutionWhich of the following figures represent the variation of particle momentum and the associated de Broglie wavelength?
View SolutionWhich of the following figure represents the variation of particle momentum and the associated de - Broglie wavelength ?
View SolutionRepresent graphically Variation of the de-Broglie wavelenght with linear momentum of a particle.
View SolutionThe wavelength of de-Broglie wave associated with a matter particle is 2Å. The momentum of the particle is
View SolutionWhich of the following graph represent the variation of particle momentum and associated de Broglie wavelength?
View SolutionWhich of following graphs correctly represents the variation of particle momentum with de-Broglie wavelength?
View SolutionWhich of the following figures represents the variation of particle momentum and associated de-Broglie wavelength
View SolutionWhich of the following figure represents the variation of particle momentum and the associated de - Broglie wavelength ?
View SolutionWhich of the following graph represent the variation of particle momentem and the associated de Broglie wavelength
View SolutionThe momentum of a particle associated with de-Broglie is wavelength of6∘A is
View SolutionWhich of the following figure represents the variation of particle momentum (P) and associated de Broglie wavelength (lambda) ?
View Solution
