The slope of the graph showing the variation of potential difference V on x axis and current on y axis gives conductor’s:Solution in Tamil
resistance
resistivity
reciprocal of resistance
conductivity
Step by step video & image solution for The slope of the graph showing the variation of potential difference V on x axis and current on y axis gives conductor’s: by Physics experts to help you in doubts & scoring excellent marks in Class 12 exams.
Updated on:21/07/2023Topper's Solved these Questions
Similar Questions
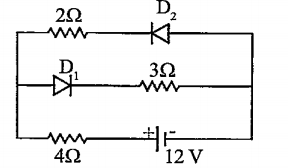
The circuit has two oppositely connected ideal diodes in parallel. What is the current flowing in the circuit ?
 .
.
View SolutionThe frequency of a light wave in a material is 2×10¹⁴ Hz and wavelength is 5000 ∘A.The refractive index of material will be
View SolutionDraw a graph showing the variation of stopping potential with frequency of the incident radiation. What does the slope of the line with frequency axis indicate? What information can be obtained from the values of intercept on the potential axis?
View Solution
There exist electric field in space such that potential gradient along y-axis and z-axis is zero. Figure shows variation of potential with x coordinate. It implies that there should be
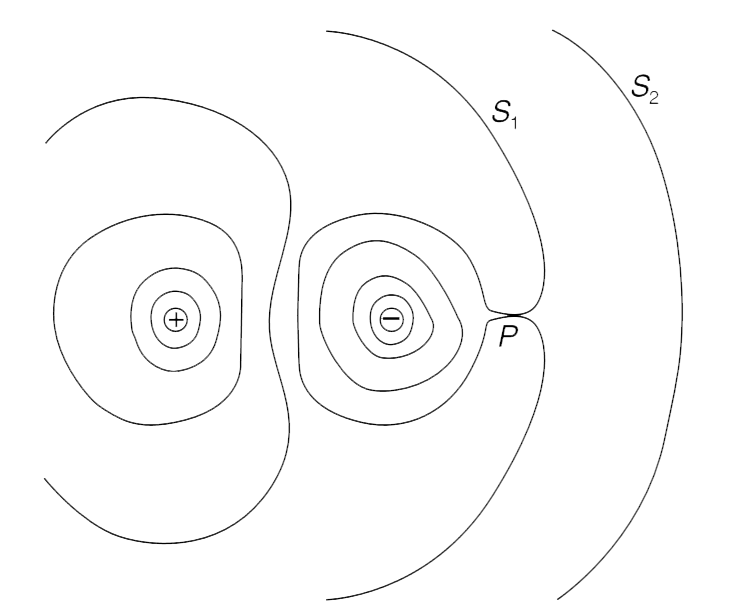
View SolutionThree point charge have been placed along the x axis at points A, B and C. Distance AB = BC. The field lines generated by the system is shown in figure. (a) Plot the variation of electric potential along x axis. Show potential on y axis of your graph. (b) Plot the variation of electric potential along y axis with B as origin. Shows potential on x axis in your graph.

View SolutionThe slope of the graph showing the variation of potential difference V on X-axis and current Y-axis gives conductor
View SolutionWrtie the slope of X-axis and Y-axis .
View SolutionA graph is drawn taking frequency of incident radiation ( v) along the X-axis and its stopping potential (V0) along the Y-axis. The nature of the graph
View SolutionPlotting a graph for momentum on the X-axis and time on Y-axis . Slope of momentum - time graph gives _________
View SolutionA graph of electric current along the y-axis and potential difference along the x-axis gives a straight line passing through the origin. What does the slope determine?
View SolutionPlotting a graph for momentum on the X-axis and time on Y-axis. Slope of momentum-time graph gives …………………………………...
View SolutionPlotting a graph for momentum on the X-axis and time on Y-axis. Slope of momentum-time graph gives …………………………………...
View Solutionआदर्श गैस के p-V ग्राफ में रुद्वोम वक्र के ढलान तथा समतापी वक्र के ढलान का अनुपात होता है (जहाँ p, y-अक्ष पर तथा V, x-अक्ष पर है)
View SolutionThe slope of the graph showing the variation of potential difference V on X-axis and current Y-axis gives conductor
View SolutionThe slope of the graph showing the variation of potential difference V on x-axis and current I on y-axis gives the conducts
View SolutionThe graph showing the varation of potential difference V along x-axis and current I along y-axis for a conductor makes an angle 40∘ with the x-axis. The resistance of the conductor will be
View Solution
