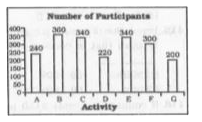
The bar graph shows how many visitors participated in which adventure activity during their stay in an adventure resort. Study the diagram and answer the following questions.
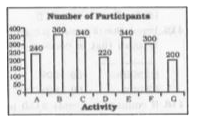
What is the ratio of participants of activity G to participants of activity B?
9:5
12:7
5:9
7:12
The correct Answer is:C
Step by step video, text & image solution for The bar graph shows how many visitors participated in which adventure activity during their stay in an adventure resort. Study the diagram and answer the following questions. What is the ratio of participants of activity G to participants of activity B? by Maths experts to help you in doubts & scoring excellent marks in Class 14 exams.
Updated on:21/07/2023Topper's Solved these Questions
- STATISTICS AND DATA INTERPRETATIONBOOK - KIRAN PUBLICATIONCHAPTER - STATISTICS AND DATA INTERPRETATIONEXERCISE - TYPE-III
39 Videos
- STATISTICS AND DATA INTERPRETATIONBOOK - KIRAN PUBLICATIONCHAPTER - STATISTICS AND DATA INTERPRETATIONEXERCISE - TYPE-IV
182 Videos
- STATISTICS AND DATA INTERPRETATIONBOOK - KIRAN PUBLICATIONCHAPTER - STATISTICS AND DATA INTERPRETATIONEXERCISE - TYPE-VIII
8 Videos
- SIMPLIFICATIONBOOK - KIRAN PUBLICATIONCHAPTER - SIMPLIFICATIONEXERCISE - TEST YOURSELF
25 Videos
- TIME AND DISTANCEBOOK - KIRAN PUBLICATIONCHAPTER - TIME AND DISTANCEEXERCISE - Type -XI
74 Videos
Similar Questions
The bar graph shows how many visitors participated in which adventure activity during their stay in an adventure resort. Study the diagram and answer the following questions.
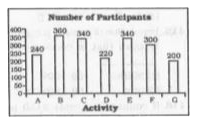
Which adventure activity has the second lowest number of participants?
View SolutionThe bar graph shows the population of different countries. Study the diagram and answer the following questions.
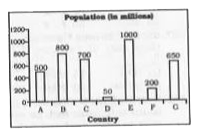
What is the ratio of population of country A to that of country G?
View Solution
Knowledge Check
The bar graph shows how many visitors participated in which adventure activity during their stay in an adventure resort. Study the diagram and answer the following questions.
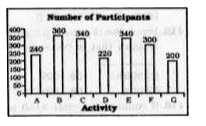
If 30% of participants of activity F had choosen to participate in activity G instead then the number of participants of G would have increased (in per cent) byA90B122.22C45D60The bar graph shows how many visitors participated in which adventure activity during their stay in an adventure resort. Study the diagram and answer the following questions.
Participants of activity A were lesser than that of F by ____%.Aa)25Bb)30Cc)20Dd)35The bar graph shows how many visitors participated in which adventure activity during their stay in an adventure resort. Study the diagram and answer the following questions.
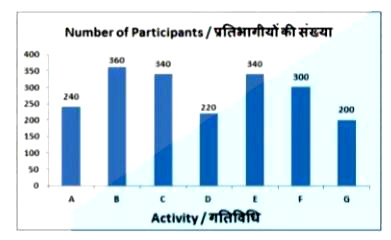
Which adventure activity had the second lowest number of participants?AFBACDDG
The bar graph shows the debt of different countries. Study the diagram and answer the following questions.
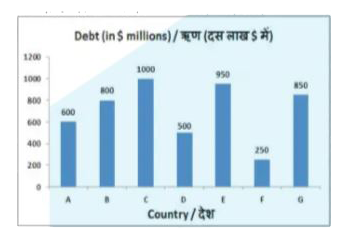
What is the ratio of debt of country A to that of country F?
View SolutionThe bar graph shows the number of soldiers in the armies of different countries. Study the diagram and answer the following questions.
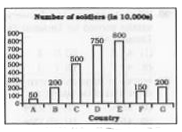
What is the ratio of number of soldiers of country B to that of country D?
View SolutionThe bar graph shows the monthly profits of the different departments of a company. Study the diagram and answer the following questions.
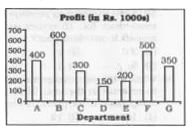
What is the ratio of the monthly profit of department G to that of department B?
View SolutionThe bar graph shows 1 month's sales of different brands of washing machines of a certain electronics store in Rs. 1000s. Study the diagram and answer the following questions.
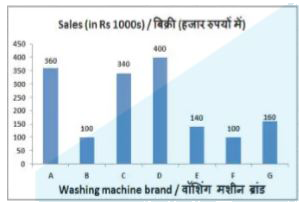
What is the ratio of sales of brand G to that of brand A?
View SolutionThe bar graph shows the production of the different departments of a company. Study the diagram and answer the following questions.
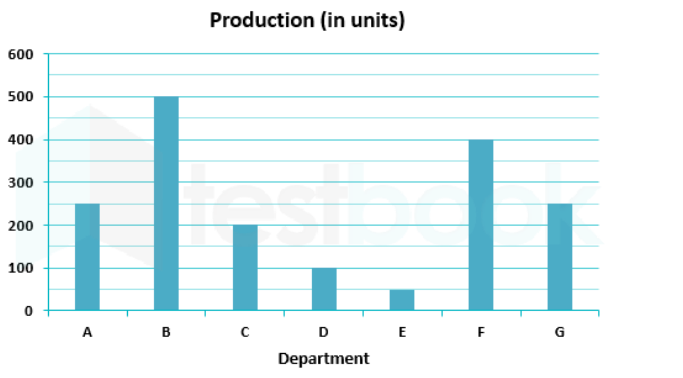
What is the ratio of production of department A to that of department F?
View Solution
