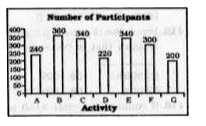
The bar graph shows how many visitors participated in which adventure activity during their stay in an adventure resort. Study the diagram and answer the following questions.
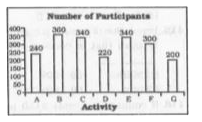
Participants of activity A were lesser than that of F by ____%.
a)25
b)30
c)20
d)35
The correct Answer is:C
Step by step video, text & image solution for The bar graph shows how many visitors participated in which adventure activity during their stay in an adventure resort. Study the diagram and answer the following questions. Participants of activity A were lesser than that of F by ____%. by Maths experts to help you in doubts & scoring excellent marks in Class 14 exams.
Updated on:21/07/2023Topper's Solved these Questions
- STATISTICS AND DATA INTERPRETATIONBook:KIRAN PUBLICATIONChapter:STATISTICS AND DATA INTERPRETATIONExercise:TYPE-III
Explore 39 Videos
- STATISTICS AND DATA INTERPRETATIONBook:KIRAN PUBLICATIONChapter:STATISTICS AND DATA INTERPRETATIONExercise:TYPE-IV
Explore 182 Videos
- STATISTICS AND DATA INTERPRETATIONBook:KIRAN PUBLICATIONChapter:STATISTICS AND DATA INTERPRETATIONExercise:TYPE-VIII
Explore 8 Videos
- SIMPLIFICATIONBook:KIRAN PUBLICATIONChapter:SIMPLIFICATIONExercise:TEST YOURSELF
Explore 25 Videos
- TIME AND DISTANCEBook:KIRAN PUBLICATIONChapter:TIME AND DISTANCEExercise:Type -XI
Explore 74 Videos
Similar Questions
The line graph shows the exprots by a certain company. Study the diagram and answer the following questions.
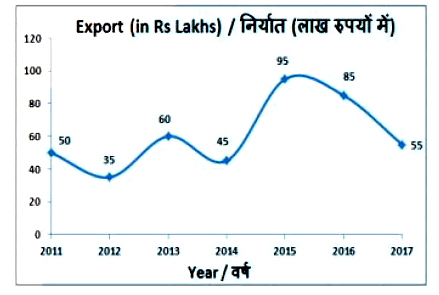
The exports in 2014 were lesser than that in 2011 by ________.
View SolutionThe bar graph shows how many visitors participated in which adventure activity during their stay in an adventure resort. Study the diagram and answer the following questions.
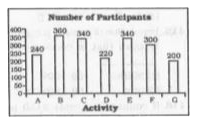
Which adventure activity has the second lowest number of participants?
View Solution
Knowledge Check
The bar graph shows how many visitors participated in which adventure activity during their stay in an adventure resort. Study the diagram and answer the following questions.
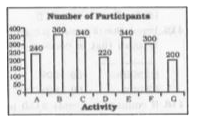
What is the ratio of participants of activity G to participants of activity B?A9:5B12:7C5:9D7:12The bar graph shows how many visitors participated in which adventure activity during their stay in an adventure resort. Study the diagram and answer the following questions.
If 30% of participants of activity F had choosen to participate in activity G instead then the number of participants of G would have increased (in per cent) byA90B122.22C45D60The bar graph shows how many visitors participated in which adventure activity during their stay in an adventure resort. Study the diagram and answer the following questions.
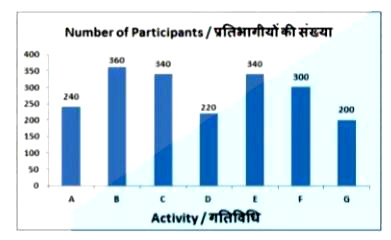
Which adventure activity had the second lowest number of participants?AFBACDDG
The bar graph shows the debt of different countries. Study the diagram and answer the following questions.
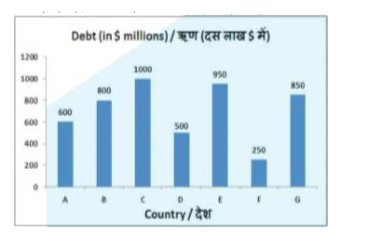
Debt of country A is lesser than that of country B by ___________.
View SolutionThe bar graph shows the population of different countries. Study the diagram and answer the following questions.
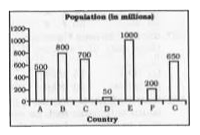
Population of country E is greater than that of country A by _____.
View SolutionThe line graphs shows the number of deaths due to dengiue in acertain state. Study the diagram and answer the following questions.
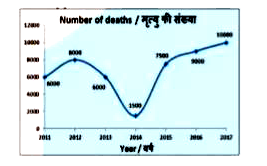
The number of deaths in 2013 were lesser than that in 2016 by ________%.
View SolutionThe line graph shows the number of vacancies for executives in a certain company. Study the diagram and answer the following questions.
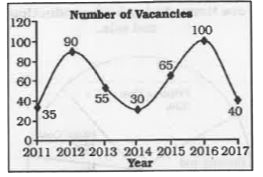
The number of vacancies in 2014 was lesser than that in 2016 by ___.
View SolutionThe line graph shows the number of vacancies for executives in a certain company. Study the diagram and answer the following questions.

The number of vacancies in 2014 was lesser than that in 2016 by ___.
View Solution