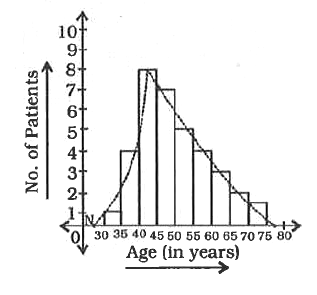
Direction: In the graph, number of patients admitted in a hospital as per age, in a day, is given. Study the graph carefully and answer the questions.
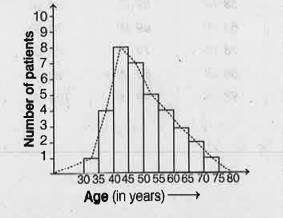
Find total number of pateints
24
37
10
35
Step by step video & image solution for Direction: In the graph, number of patients admitted in a hospital as per age, in a day, is given. Study the graph carefully and answer the questions. Find total number of pateints by Maths experts to help you in doubts & scoring excellent marks in Class 14 exams.
Updated on:21/07/2023Similar Questions
Direction: In the graph, number of patients admitted in a hospital as per age, in a day, is given. Study the graph carefully and answer the questions.
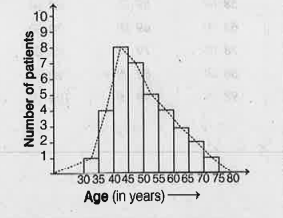
Find total number of patients between 55 yr to 60 yr, admitted in hospital in a day.
View SolutionDirections: The following bar graph shows the number of pages in five different books (viz. A, B, C, D and E). Study the graph carefully and answer the following questions.
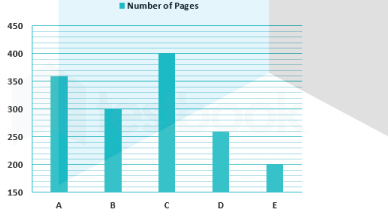
What is the ratio of total number of pages in book B and E together to the total number of pages in book C and D together?
View Solution
Knowledge Check
The diagram shows the age-distribution of the patients admitted to a hospital on a particular day. Study the diagram and particularly day. Study the diagram and answer the questions.
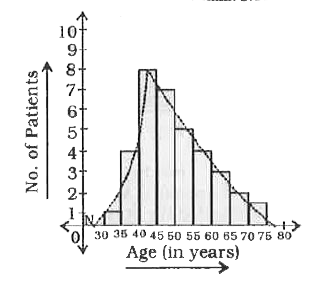
Total number of patients of age more than 55 years, who got admitted to the hospital isA4B7C9D10The diagram shows the age-distribution of the patients admitted to a hospital on a particular day. Study the diagram and particularly day. Study the diagram and answer the questions.
Number of patients of age between 55 years to 60 years, who got admitted to the hospital on that day isA6B4C24D8The diagram shows the age-distribution of the patients admitted to a hospital on a particular day. Study the diagram and particularly day. Study the diagram and answer the questions.
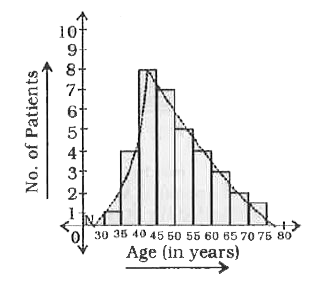
Number of patients of age more than 40 years and less than 55 years, who got admitted to the hospital on that day isA20B30C15D12
The bar graph given here shows the number of jobseekers of a state in various years at different stages of education.
Study the graph carefully and answer the question based on it.
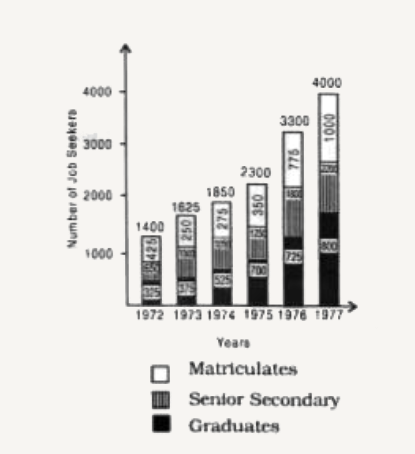
The number of job-seekers, having their qualification as Senior Secondary, in the year 1974 was :
View SolutionThe bar graph given here shows the number of jobseekers of a state in various years at different stages of education.
Study the graph carefully and answer the question based on it.
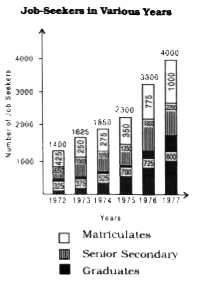
In which year, was the number of Matriculate job-seekers maximum ?
View SolutionThe diagram shows the age-distribution of the patients admitted to a hospital on a particular day. Study the diagram and particularly day. Study the diagram and answer the questions.
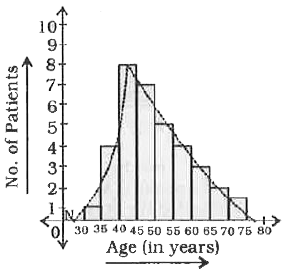
Percentage of patients of age less than 45 years, who got admitted to the hospital on that day is approximately equal to
View SolutionThe diagram shows the age-distribution of the patients admitted to a hospital on a particular day. Study the diagram and particularly day. Study the diagram and answer the questions.

Total number of patients of age more than 55 years, who got admitted to the hospital is
View SolutionStudy the graph carefully and answer the following questions.
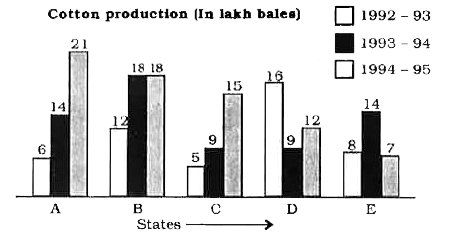
Which of the following statement is false ?
View Solution
