The pie chart, given here show some automobile parts manufactured by an automobile company at its Pune and Nagpur plants in the year 2009.
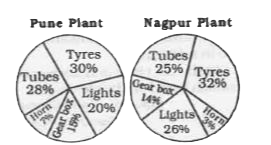
How many percent more tubes were produced at the Pune plant than those produced at the Nagpur plant?
(A)
(B)
(C)
(D)
The correct Answer is:B
Step by step video, text & image solution for The pie chart, given here show some automobile parts manufactured by an automobile company at its Pune and Nagpur plants in the year 2009. How many percent more tubes were produced at the Pune plant than those produced at the Nagpur plant? by Maths experts to help you in doubts & scoring excellent marks in Class 14 exams.
Topper's Solved these Questions
- BOOK - KIRAN PUBLICATIONCHAPTER - STATISTICS AND DATA INTERPRETATIONEXERCISE - TYPE-VIII8videos
STATISTICS AND DATA INTERPRETATION
- BOOK - KIRAN PUBLICATIONCHAPTER - STATISTICS AND DATA INTERPRETATIONEXERCISE - TYPE-VI86videos
STATISTICS AND DATA INTERPRETATION
- BOOK - KIRAN PUBLICATIONCHAPTER - SIMPLIFICATIONEXERCISE - TEST YOURSELF25videos
SIMPLIFICATION
- BOOK - KIRAN PUBLICATIONCHAPTER - TIME AND DISTANCEEXERCISE - Type -XI74videos
TIME AND DISTANCE
Similar Questions
Directions The pie-charts, given here show some automobile parts manufactured by an automobile company at its Pune and Nagpur plants in the year 2009. Study the pie-charts and answer questions.
 The ratio of number of horns produced at Nagpur plant to that produced at Pune plant is (A) 3 :7 (B) 10 :3 (C) 7 :3 (D) 7 :10 View Solution
The line chart given below shows the ratio of production to sales of two bike-manufacturing firms over the period of 6 years.
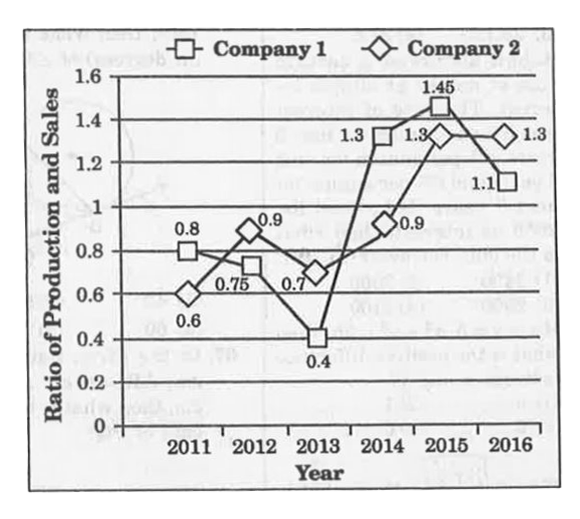
Assume if in any year sales is more than production then both the companies have sufficient stock to meet such instances.
The production of company 2 in year 2012 is 30000. If sales of company 2 in year 2012 and 2013 are same, then what was its production (in units) in year 2013?View Solution
Knowledge Check
- Question 1 - Select One
The pie chart, given here show some automobile parts manufactured by an automobile company at its Pune and Nagpur plants in the year 2009.
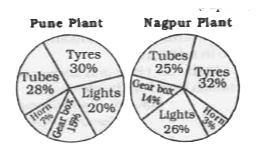
The ratio of number of horns produced at Nagpur plant to that produced at Pune plant isA3:7B10:3C7:3D7:10 - Question 2 - Select One
The pie chart, given here show some automobile parts manufactured by an automobile company at its Pune and Nagpur plants in the year 2009.
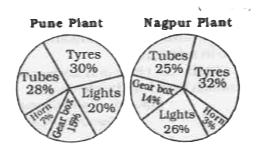
If the Nagpur plant produced 8,00,000 tyres, then the number of horns produced by it wasA(A) 12000B(B) 18500C(C) 75000D(D) 60000 - Question 3 - Select One
The line chart given below shows the sales (in crores) of a complany for the years 2009 to 2016
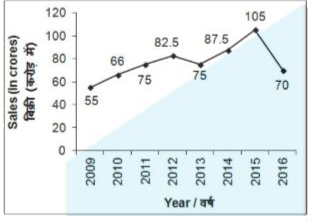
In how many years was the sale of the company more than the sale in 2011?A4B5C3D2
The pie chart given here shows the spendings of a country on various sports during a particular year. Study the chart carefully and answer the questions given below it.
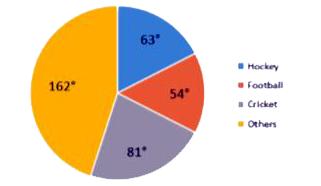
How much percent less is spent on Football than that on Cricket?View SolutionThe line chart given below shows the revenue of a company (in lac rupees) from year 2009 to 2016
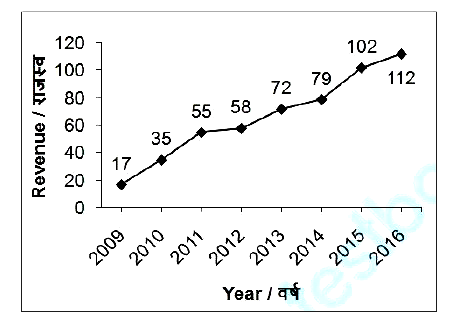
In how many years from 2010 to 2016 the increase in the revenue is more than 20% of the previous year value?View SolutionThe line chart given below shows the profit (in crores) of a company for the years 2008 to 2015.
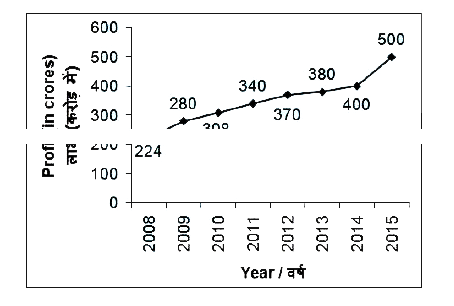
In how many years from 2009 to 2015 the increase in profit with respect to previous years is more than 30 crores?View SolutionThe line chart given below shows the revenue of a company (in lac rupees) from year 2009 to 2016.
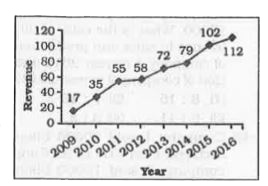
In how many years from 2010 to 2016 the increase in the revenue is more than 20% of the previous year value?View SolutionThe line chart given below shows the number of students in 2 sections X and Y from year 2009 to 2016.
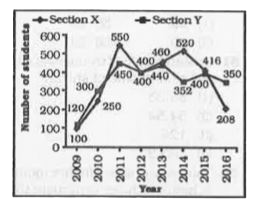
For how many years was the number of students in section Y was more than that of section X?View Solution
