The pie chart, given here show some automobile parts manufactured by an automobile company at its Pune and Nagpur plants in the year 2009.
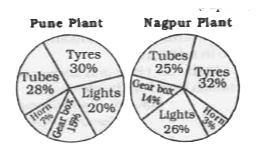
The ratio of number of horns produced at Nagpur plant to that produced at Pune plant is
3:7
10:3
7:3
7:10
The correct Answer is:A
Step by step video, text & image solution for The pie chart, given here show some automobile parts manufactured by an automobile company at its Pune and Nagpur plants in the year 2009. The ratio of number of horns produced at Nagpur plant to that produced at Pune plant is by Maths experts to help you in doubts & scoring excellent marks in Class 14 exams.
Updated on:21/07/2023Topper's Solved these Questions
- STATISTICS AND DATA INTERPRETATIONBOOK - KIRAN PUBLICATIONCHAPTER - STATISTICS AND DATA INTERPRETATIONEXERCISE - TYPE-VIII
8 Videos
- STATISTICS AND DATA INTERPRETATIONBOOK - KIRAN PUBLICATIONCHAPTER - STATISTICS AND DATA INTERPRETATIONEXERCISE - TYPE-VI
86 Videos
- SIMPLIFICATIONBOOK - KIRAN PUBLICATIONCHAPTER - SIMPLIFICATIONEXERCISE - TEST YOURSELF
25 Videos
- TIME AND DISTANCEBOOK - KIRAN PUBLICATIONCHAPTER - TIME AND DISTANCEEXERCISE - Type -XI
74 Videos
Similar Questions
Directions The pie-charts, given here show some automobile parts manufactured by an automobile company at its Pune and Nagpur plants in the year 2009. Study the pie-charts and answer questions.
 The ratio of number of horns produced at Nagpur plant to that produced at Pune plant is (A) 3 :7 (B) 10 :3 (C) 7 :3 (D) 7 :10
View SolutionThe table given below shows production of five types of cars by a company from the 1998 to 2003. Study the table and answer the questions.
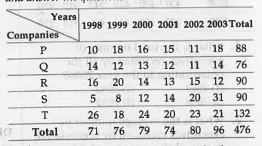
What is the ratio of total number of cars produced by all the companies together in the years 2003 and 1999?
View Solution
Knowledge Check
The pie chart, given here show some automobile parts manufactured by an automobile company at its Pune and Nagpur plants in the year 2009.
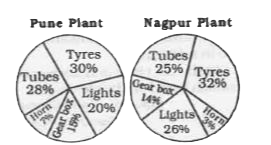
How many percent more tubes were produced at the Pune plant than those produced at the Nagpur plant?A(A) 14%B(B) 12%C(C) 8%D(D) 3%The pie chart, given here show some automobile parts manufactured by an automobile company at its Pune and Nagpur plants in the year 2009.
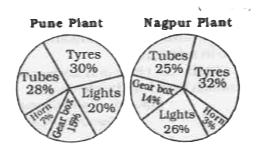
If the Nagpur plant produced 8,00,000 tyres, then the number of horns produced by it wasA(A) 12000B(B) 18500C(C) 75000D(D) 60000The line chart given blow shows the number of cars manufactured (in 000') by company X in year 2015 from the month of July to December.
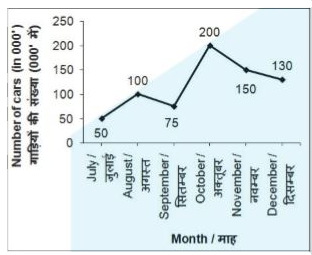
In how many months was the number of cars manufactured a multiple of 10,000?A6B5C4D7
The bar graph, given here, shows the diamond and production of colour televisions of five companies for Diwali season in the year 2009. Study the graph carefully and answer the questions based on the graph.
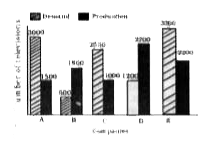
The ratio of the demand and production of colour televisions of company E is :
View SolutionThe line chart given blow shows the number of cars manufactured (in 000') by company X in year 2015 from the month of July to December.
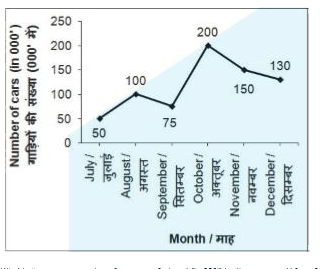
What is the average number of cars manufactured (in 000') by the company X from July to November?
View SolutionThe line chart given blow shows the number of cars manufactured (in 000') by company X in year 2015 from the month of July to December.
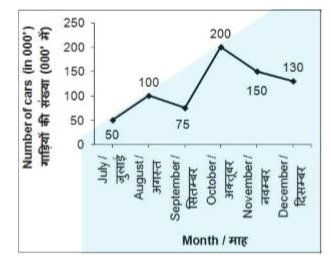
What is the percentage change in the number of cars manufactured in December to that in July?
View SolutionThe given pie chart shows information about the mobile phone manufacturing companies in India .The total number of mobile phone units manufactures is 12, 40 , 00 units .
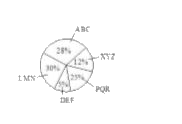 Which company produces the maximum number of mobile phone ?
View SolutionThe line chart given blow shows the number of cars manufactured (in 000') by company X in year 2015 from the month of July to December.
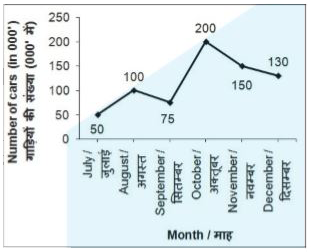
What is the difference between the maximum and minimum number of cars manufactured among the given months as a percentage of the cars manufactured in September?
View Solution
