On a particular day in a school, the attendance in each of the classes from VI to X has been recorded as under
Draw a double bar graph, choosing an appropriate scale. Using the bar graph, answer the questions given below

(i) Which class has the maximum number of students (ii) Find the ratio of number of students present to the total number of students in Class VII. (iii) What percent of Class IX students were absent
The correct Answer is:(i) class VI
(ii) 17:18
(iii) 8
Step by step video, text & image solution for On a particular day in a school, the attendance in each of the classes from VI to X has been recorded as under Draw a double bar graph, choosing an appropriate scale. Using the bar graph, answer the questions given below (i) Which class has the maximum number of students (ii) Find the ratio of number of students present to the total number of students in Class VII. (iii) What percent of Class IX students were absent by Maths experts to help you in doubts & scoring excellent marks in Class 7 exams.
Topper's Solved these Questions
- BOOK - RS AGGARWALCHAPTER - BAR GRAPHSEXERCISE - EXERCISE 2222videos
BAR GRAPHS
- BOOK - RS AGGARWALCHAPTER - ALGEBRAIC EXPRESSION EXERCISE - EXERCISE 6D31videos
ALGEBRAIC EXPRESSION
- BOOK - RS AGGARWALCHAPTER - COLLECTION AND ORGANISATION OF DATA (MEAN, MEDIAN AND MODE)EXERCISE - EXERCISE 21C5videos
COLLECTION AND ORGANISATION OF DATA (MEAN, MEDIAN AND MODE)
Similar Questions
Observe the following data:
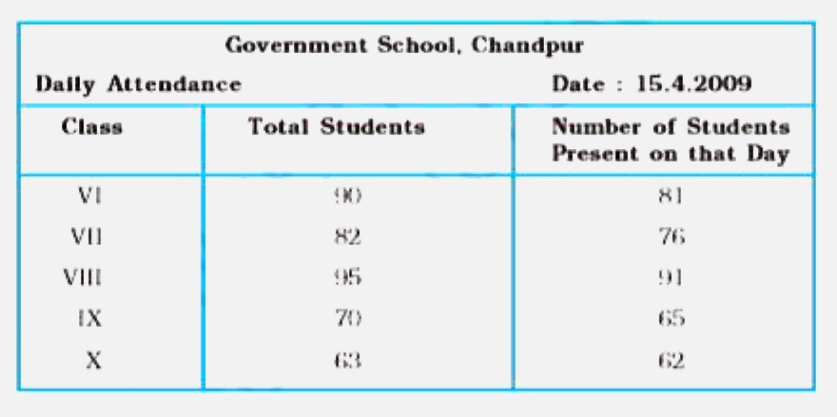
(a) Draw a double bar graph choosing an appropriate scale. What do you infer from the bar graph?
(b) Which class has the maximum number of students?
(c) In which class, the difference of total students and number of students present is minimum?
(d) Find the ratio of number of students present to the total number of students of Class IX.
(e) What per cent of Class VI students were absent?View SolutionLook at the histogram given below and answer the questions that follow:
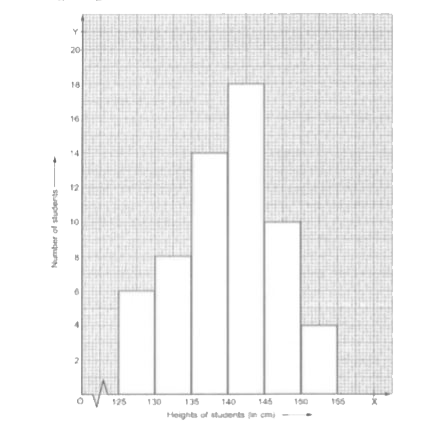
Which class interval has the least number of students ?View Solution
Knowledge Check
- Question 1 - Select One
Study the double bar graph given below and answer the question.
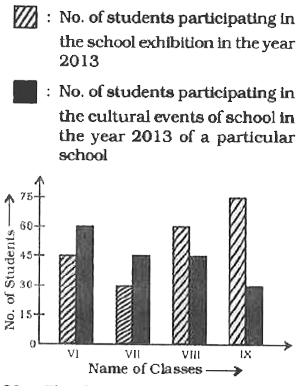
The class having maximum number of participants in exhibition isAClass IXBClass VIIICClass VIIDClass VI
The given bar graph, shows the number of students in different classes.
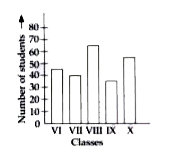
Find the total number of students in the classes VIII to X.View SolutionRead the bar graph carefully and answer the following questions.
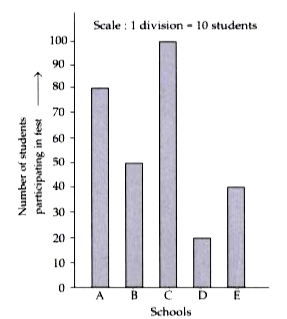 From which school maximum number of students participated ?View Solution
Read the bar graph given below and answer the following questions:

In which year is the number of students maximum?View SolutionStudy the following bar graph and answer the questions given below.
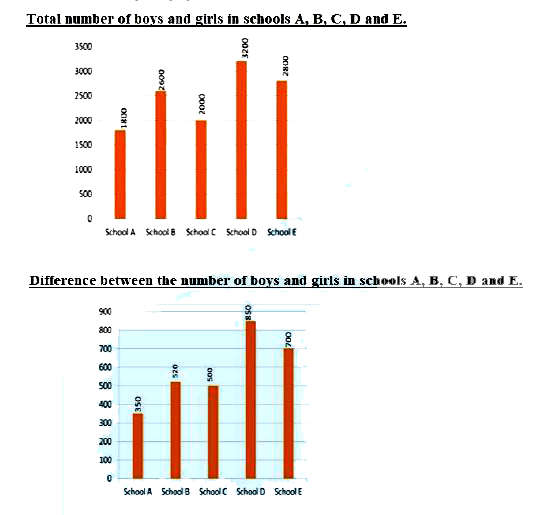
What is the ratio of numbers of boys to the number of girls in school E?View SolutionRead the bar graph given below and answer the following questions:

In which year is the number of students twice as that of 2001-02?View SolutionStudy the following bar graph and answer the questions given below.
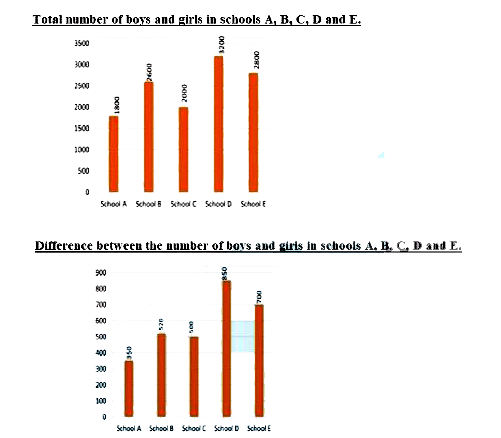
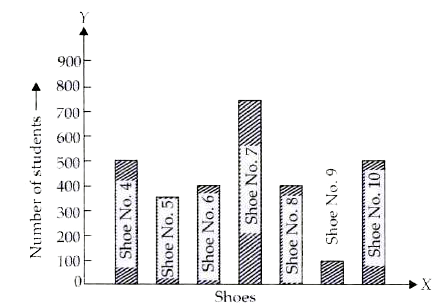
The number of boys in school B is what percentage of the total number of students in that school ?View SolutionRead the bar graph shown in figure and answer the following questions.
Which shoe number is worn by the maximum number of students? Also give its number
 View Solution

