Which of the following graphs represent the behaviour of an ideal gas ? Solution in Malayalam


The correct Answer is:A, D
Step by step video, text & image solution for Which of the following graphs represent the behaviour of an ideal gas ? by Chemistry experts to help you in doubts & scoring excellent marks in Class 11 exams.
Topper's Solved these Questions
- BOOK - BRILLIANT PUBLICATIONCHAPTER - STATES OF MATTER EXERCISE - LEVEL III (Numerical Type)7videos
STATES OF MATTER
- BOOK - BRILLIANT PUBLICATIONCHAPTER - STATES OF MATTER EXERCISE - LEVEL III (Matching Column Type .)7videos
STATES OF MATTER
- BOOK - BRILLIANT PUBLICATIONCHAPTER - STATES OF MATTER EXERCISE - LEVEL III (Single Correct Answer Type)10videos
STATES OF MATTER
- BOOK - BRILLIANT PUBLICATIONCHAPTER - SOME BASIC CONCEPTS OF CHEMISTRYEXERCISE - LEVEL-I55videos
SOME BASIC CONCEPTS OF CHEMISTRY
- BOOK - BRILLIANT PUBLICATIONCHAPTER - STRUCTURE OF ATOMSEXERCISE - LEVEL - III (Linked Comprehension Type)8videos
STRUCTURE OF ATOMS
Similar Questions
At 400 K, the root mean square (Ims) speed ofa gas X(molecular weight=40) is equal to the most probable speed of gas Y at 60 K. The molecular weight of Y is
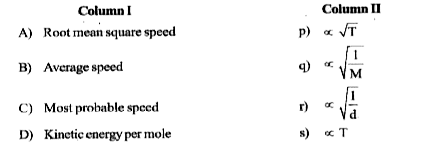
View SolutionMatch the term with the expression.
 02:06View Solution
What percentage of a sample of nitrogen must be allowed to escape if its temperature, pressure and volume are changed from 220∘C, 3.0 atm and 1.65 L to 110∘C, 0.7 atm and 1.0 L respectively? : 0.1813, 0.34, 0.62, 0.8187
03:28View SolutionWhich of the following is a characteristic of both mixtures and compounds?
02:27View SolutionThe hydrogen-like species Ļi2+ is in a spherically symmetric state S1 with one radial node. Upon absorbing light the ion undergoes transition to a state S2 The state S2 has one radial node and its energy is equal to the ground state energy of the hydrogen atom.
The state S1 is: 1s, 2s, 2p, 3sView SolutionWhich of the following graphs is consistent with ideal gas behaviour?
02:29View SolutionGraph depicting correct behaviour of ideal gas and H_(2) gas will be (neglect a):
04:23View SolutionWhich of the following graphs is inconsistent with ideal gas behaviour ? (Assume n = constant)
View SolutionThe graph that does not repersent the behaviour of an ideal gas is-
02:29View SolutionThe graph that does represent the behaviour of an ideal gas is :
View SolutionWhich of the following graphs represent the behaviour of an ideal gas ?
View SolutionWhich one of the following graphs correctly gives the ideal gas behaviour ?
01:42View SolutionWhich one of the following graphs represents the behaviour of an ideal gas.
01:42View SolutionWhich of the following graphs represent the behaviour of an ideal gas ?
01:41View SolutionWhich curve in the following graph represents the curve of ideal gas ?
03:52View SolutionWhich of the following graphs represent the behaviour of an ideal gas ?
05:54View Solution

