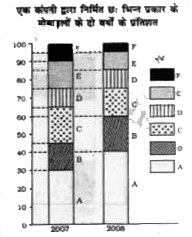
नीचे दिए स्तंभ आरेख में एक मोबाइल निर्माता कंपनी द्वारा वर्ष 2007 तथा 2008 में विभिन्न मॉडलों के मोबाइलों के प्रतिशत बंटन को दर्शाया गया है। वर्ष 2007 में मोबाइल फोनों का कुल उत्पादन 35 लाख था और 2008 में वह 44 लाख था।
एक कंपनी द्वारा निर्मित छ : भिन्न प्रकार के मोबाइलों के दो वर्षो के प्रतिशत

वर्ष 2007 में निर्मित A,B तथा E मॉडलों के मोबाइलों की कुल संख्या कितनी है ?
24,50,000
22,75,000
21,00,000
19,25,000
The correct Answer is:C
Step by step video, text & image solution for नीचे दिए स्तंभ आरेख में एक मोबाइल निर्माता कंपनी द्वारा वर्ष 2007 तथा 2008 में विभिन्न मॉडलों के मोबाइलों के प्रतिशत बंटन को दर्शाया गया है। वर्ष 2007 में मोबाइल फोनों का कुल उत्पादन 35 लाख था और 2008 में वह 44 लाख था। एक कंपनी द्वारा निर्मित छ : भिन्न प्रकार के मोबाइलों के दो वर्षो के प्रतिशत वर्ष 2007 में निर्मित A,B तथा E मॉडलों के मोबाइलों की कुल संख्या कितनी है ? by Maths experts to help you in doubts & scoring excellent marks in Class 14 exams.
Similar Questions
The given bar graph presents the number of different types of vehicles (in lakhs) exported by a company during 2014 and 2015. दिया गया दंड आरेख एक कंपनी के द्वारा 2014 और 2015 में निर्यात किये गए अलग-अलग प्रकार के वाहनों की संख्या ( लाख में ) को दर्शाता है | Which type of vehicle showed 32% increase in export in 2015 as compared to that in the previous year? किस प्रकार के वाहन के निर्यात में पिछले वर्ष की तुलना में 2015 में 32% की वृद्धि देखने को मिली ?
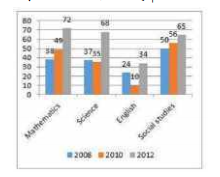
01:43View SolutionThe given bar graph shows the number of marks scored by a student in each subject in three years.
दिया गया दंड आरेख एक छात्र के द्वारा तीन वर्षो में प्रत्येक विषय में लाये गए अंकों को दर्शाता है | In the given chart, what is the percentage increase in marks in Mathematics in 2012 compared to 2008 (round off) ? /
इस आरेख में वर्ष 2008 की तुलना में वर्ष 2012 में गणित के अंकों में कितने प्रतिशत की वृद्धि हुई है ?01:57View SolutionThe bar graph given below shows the wheat production (in tonnes) of a large farm during the year 2011-2018. In how many years was wheat production higher than the average production of the period? नीचे दिए गए दंड आरेख में वर्ष 2011-2018 के दौरान किसी बड़े फार्म के गेहूं उत्पादन (टन में) को दर्शाया गया है | अवधि के औसत उत्पादन की तुलना में दिए गए कितने वर्षो में गेहूं उत्पादन अधिक था ?
02:22View SolutionThe bar graph given below shows the profit (in multiples of thousand rupees) of a company during the year 2010-2018. The average profit for the year 2015-2017 is what percentage more than the 2012 profit? नीचे दिए गए दंड आरेख में वर्ष 2010-2018 के दौरान किसी कंपनी के लाभ (हजार रुपए के गुणक में) को दर्शाया गया है | वर्ष 2015-2017 का औसत लाभ 2012 के लाभ से कितना प्रतिशत अधिक है ?
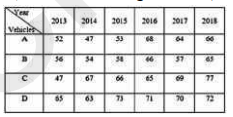
01:37View SolutionThe table given below presents the figures of the production (in thousands) of different types of vehicles by a company during the year 2013-18.
नीचे दी गयी तालिका वर्ष 2013-18 के दौरान एक कंपनी के द्वारा विभिन्न प्रकार के वाहनों के उत्पादन ( हज़ार में)के आंकड़ों को प्रस्तुत करती है | In how many years is the production of type C vehicles, below the average production of type D vehicles over six years?
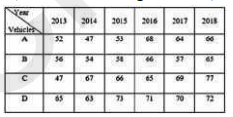
कितने वर्ष C प्रकार के वाहनों का उत्पादन इन छः वर्षों में D प्रकार के वाहनों के औसत उत्पादन से कम रहा है ?02:19View SolutionThe table given below presents the figures of the production (in thousands) of different types of vehicles by a company during the year 2013-18.
नीचे दी गयी तालिका वर्ष 2013-18 के दौरान एक कंपनी के द्वारा विभिन्न प्रकार के वाहनों के उत्पादन ( हज़ार में)के आंकड़ों को प्रस्तुत करती है | The total production of all types of vehicles in 2018 is what percent more than the total production of all types of vehicles in 2015?
2018 में सभी प्रकार के वाहनों का कुल उत्पादन 2015 में सभी प्रकार के वाहनों के कुल उत्पादन से कितना प्रतिशत अधिक है ?02:45View SolutionStudy the following graph which shows income and expenditure of a company over the years and answer the questions. The difference in profit (in crores) of the company during 2007 and 2008 is. निम्नलिखित चार्ट का अध्ययन कीजिए जिसमें कंपनी की कुछ वर्षों की आय एवं उसके व्यय को दर्शाया गया है और प्रश्नों के उत्तर दीजिए : वर्ष 2007 और 2008 में कंपनी के लाभ में अंतर (₹ करोड़ में) कितना है?
01:28View SolutionStudy the following graph which shows income and expenditure of a company over the years and answer the questions. The percentage increase in income of the company from 2007 to 2008 is. निम्नलिखित चार्ट का अध्ययन कीजिए जिसमें कंपनी की कुछ वर्षों की आय एवं उसके व्यय को दर्शाया गया है और प्रश्नों के उत्तर दीजिए : वर्ष 2007 से 2008 तक कंपनी की आय में वृद्धि का प्रतिशत कितना रहा?
01:37View Solution

