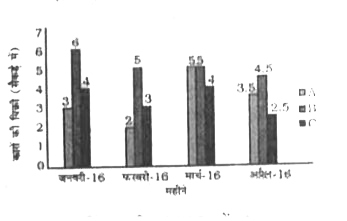
दिया गया दंड आरेख (बार ग्राफ) तीन शोरूम - A,B और C के द्वारा जनवरी , फरवरी , मार्च और अप्रैल ,2016 के दौरान कार के एक खास ब्रांड की (100 के गुणक में) बिक्री को दर्शाता है।

जनवरी-फरवरी ,2016 में A द्वारा और मार्च-अप्रैल 2016 के दौरान B के द्वारा बेचीं गयी कारो की संख्या का अनुपात क्या है ?
5:8
8:17
12:19
10:19
The correct Answer is:D
Step by step video & image solution for दिया गया दंड आरेख (बार ग्राफ) तीन शोरूम - A,B और C के द्वारा जनवरी , फरवरी , मार्च और अप्रैल ,2016 के दौरान कार के एक खास ब्रांड की (100 के गुणक में) बिक्री को दर्शाता है। जनवरी-फरवरी ,2016 में A द्वारा और मार्च-अप्रैल 2016 के दौरान B के द्वारा बेचीं गयी कारो की संख्या का अनुपात क्या है ? by Maths experts to help you in doubts & scoring excellent marks in Class 14 exams.
Updated on:21/07/2023Similar Questions
The given table represents the number of computers sold by four dealers A,B, C and D during the first six months of 2016. Study the table carefully and answer the questions that follows: दी गयी तालिका चार विक्रेताओं A, B, C और D के द्वारा 2016 के पहले छः महीनों में बेचे गए कंप्यूटरों की संख्या दर्शाती है | इस तालिका का ध्यानपूर्वक अध्ययन करें तथा पूछे गए प्रश्नों का उत्तर दें | What is the ratio of the total number of computers sold by dealer A in February, April and May to the total number of computers sold by dealer D in March, May and June? / विक्रेता A के द्वारा फरवरी, अप्रैल और मई में बेचे गए कंप्यूटरों की कुल संख्या तथा विक्रेता D के द्वारा मार्च, मई और जून में बेचे गए कंप्यूटरों की कुल संख्या के बीच क्या अनुपात है ?
View SolutionThe given table represents the number of computers sold by four dealers A,B, C and D during the first six months of 2016. Study the table carefully and answer the questions that follows: दी गयी तालिका चार विक्रेताओं A, B, C और D के द्वारा 2016 के पहले छः महीनों में बेचे गए कंप्यूटरों की संख्या दर्शाती है | इस तालिका का ध्यानपूर्वक अध्ययन करें तथा पूछे गए प्रश्नों का उत्तर दें | The total number of computers sold by dealer B in April, May and June is what percentage of the total number of computers sold by all the dealers in February and April? / विक्रेता B के द्वारा अप्रैल, मई और जून में बेचे गए कंप्यूटरों की कुल संख्या सभी विक्रेताओं के द्वारा फरवरी एवं अप्रैल में बेचे गए कंप्यूटरों की कुल संख्या का कितना प्रतिशत है ?
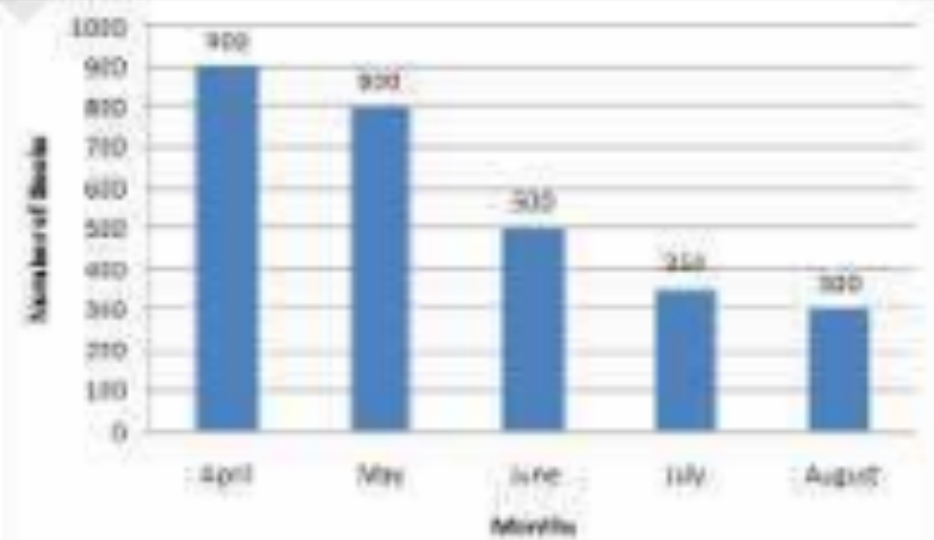
View SolutionThe following graph shows the number of books sold by a book-seller during five-months of 2019, April, May, June, July and August. Study the graph and answer the questions:
निम्नलिखित आरेख, 2019 के अप्रैल, मई, जून, जुलाई और अगस्त के पांच महीनों के दौरान एक पुस्तक-विक्रेता द्वारा बेची गई पुस्तकों की संख्या को दर्शाता है। आरेख का अध्ययन करें और प्रश्नों के उत्तर दें: The total number of books sold during these five month is:
इन पाँच महीनों के दौरान बेची गई पुस्तकों की कुल संख्या है:
View SolutionThe given Bar Graph presents different types of vehicles (in lakhs) exported by a company in 2016 and 2017.What is the ratio of the total number of vehicles of type D and E exported by the company in 2016 to that of vehicles of type C and E exported in 2017? दिया गया दंड आरेख (बार ग्राफ) 2016 और 2017 में किसी कंपनी द्वारा निर्यात किए गए विभिन्न प्रकार के वाहनों (लाखों में) को दर्शाता है| 2016 में कंपनी द्वारा निर्यात किए जाने वाले D और E टाइप के वाहनों की कुल संख्या और 2017 में निर्यात किए गए C और E टाइप के वाहनों का अनुपात क्या है?
View SolutionThe given Bar Graph presents Income and Expenditure (in crores of Rupees) of a company for five years, 2014 to 2018. What is the ratio of total Expenditure to total Income of the company in 2014,2016 and 2017? दिया गया दंड आरेख (बार ग्राफ) 5 वर्षों, 2014 से 2018 के दौरान किसी कंपनी की आय और व्यय (करोड़ रुपए में) को दर्शाता है| 2014, 2016 और 2017 में कंपनी के कुल व्यय और कुल आय का अनुपात क्या है?
View SolutionThe given Bar Graph present the Imports and Exports of an item (in tonnes) manufactured by a company for the five financial years, 2013-2014 to 2017-2018. दिया गया दंड आरेख (बार ग्राफ) पांच वित्त वर्षों, 2013-2014 से 2017-2018, के दौरान किसी कंपनी दवारा निर्यात किसी वस्तु (टन में] के आयात और निर्यात को दर्शाता है| What is the ratio of total Imports to total Exports during 2014- 2015, 2015- 2016 and 2016- 2017? वर्ष 2014-2015, 2015-2016 33 2016-2011 के दौरान, कुल आयात और निर्यातों का अनुपात कितना है?
View SolutionThe given Bar Graph presents the number of students of two schools for six years. दिया गया दंड आरेख (बार ग्राफ) छह वर्षो के दौरान दो स्कूलों में विद्यार्थियों की संख्या को दर्शाता है| What is the ratio of the students taken for all years together from school B to that from school A? सभी वर्षों के दौरान स्कूल B और स्कूल A के कुत्र विद्यार्थियों का अनुपात क्या है?
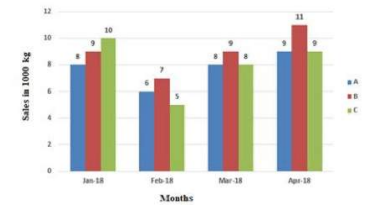
View SolutionThe given Bar Graph presents the sale (in 1000kg) of a particular brand of tea by three outlets, A, B and C during the months of Jan, Feb, Mar and Apr, 2018.
दिया गया दंड आरेख (बार ग्राफ) तीन विक्रय केंद्रों A, B और C के दवारा चाय के किसी खास ब्रांड की जनवरी , फरवरी ,मार्च और अप्रैल ,2018 के दौरान (1000 kg में ) बिक्री को दर्शाता है | What is the ratio of the rate of growth in sales from B to the rate of growth in sales from C in Mar 2018 with reference to its previous month?
पिछले महीने की तुलना में ,मार्च 2018 में B की बिक्री वृद्धि-दर तथा C की बिक्री वृद्धि-दर का क्या अनुपात है ?
View Solution
