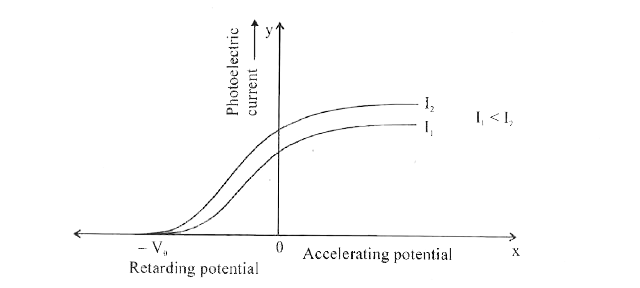
Draw properly labelled graphs to show the following concerning photoelectric emission:
variation of photoelectron current with accerlarating and retarding potenetial ,andSolution in Punjabi
Step by step video & image solution for Draw properly labelled graphs to show the following concerning photoelectric emission:variation of photoelectron current with accerlarating and retarding potenetial ,and by Physics experts to help you in doubts & scoring excellent marks in Class 12 exams.
Updated on:21/07/2023Topper's Solved these Questions
- Particle Nature of RadiationBOOK - MODERN PUBLICATIONCHAPTER - Particle Nature of RadiationEXERCISE - EXERCISE
94 Videos
- Optical InstrumentsBOOK - MODERN PUBLICATIONCHAPTER - Optical InstrumentsEXERCISE - EXERCISE
100 Videos
- Polarisation of LightBOOK - MODERN PUBLICATIONCHAPTER - Polarisation of LightEXERCISE - EXERCISE
50 Videos
Similar Questions
What is photoelectric effect? State it laws?
View SolutionExplain briefly the structure of human eye.
View SolutionWhat do you understand by polarisation of light ?Describe an experiment to demonstrate transverse nature of light.
View SolutionWhich one of the following graphs in figure shows the variation of photoelectric current (I) with voltage (V) between the electrodes in a photoelectric cell?
View SolutionDefine: (i) photoelectron and (ii) photoelectric current
View SolutionDraw a graph to show the dependence of stopping potential on the frequency of incident light in case of photoelectric effect. Indicate the threshold frequency in the graph.
View SolutionDraw graphs showing variation of photoelectric current with applied voltage for two incident radiations of equal frequency and different instensities. Mark the graph for the radiation of higher instensity.
View SolutionDraw a graph between intensity of light and photoelectric current for a given frequency .
View SolutionDraw a graph, showing the effect of potential on photoelectric current. Hence define stopping potential.
View Solution
The graph shows the variation of photoelectric current with accelerating potential of different intensities.
a. What conclusion do you arrive from the graph?
b. Photoelectric current is not zero even if the accelerating voltage is zero. Justify your answer.
c. Why two curves meet at one point on the retarding potential axis ?
View SolutionDraw graphs showing variation of photoelectric current with applied voltage for three incident radiations of equal frequency and different intensities. Mark the graph for the radiation of higher intensity.
View SolutionDraw a graph showing the variation of stopping potential with frequency of incident raditions in relation to photoelectric effect. Deduce an expression for the slope of this graph using Einstein's photoelectric equation.
View SolutionDraw a well labelled diagram of photoelectric cell.
View SolutionHow photoelectric current is related to the number of photoelectrons emitted ?
View SolutionThe graph shows photoelectric current with anode potential. The potential at .O. is called

View SolutionA slab of ice at 0^@ C is constantly heated till the steam is formed at 100^@ C. Draw a graph showing the change in temperature with time. Label the various parts of the graph properly.
View Solution
