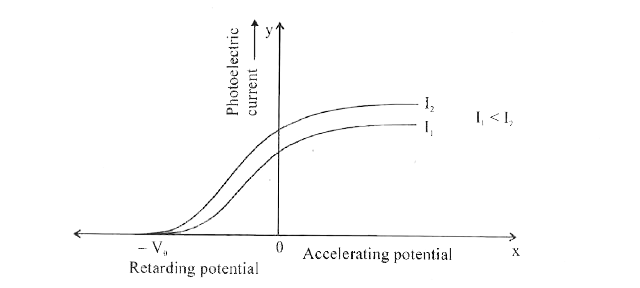
The graph shows the variation of photoelectric current with accelerating potential of different intensities.
a. What conclusion do you arrive from the graph?
b. Photoelectric current is not zero even if the accelerating voltage is zero. Justify your answer.
c. Why two curves meet at one point on the retarding potential axis ? Solution in Tamil
a. As intensity increases, intensity of photocurrent also increases.
b. Because all electrons are not ejected with same KE. When acceleration voltage is zero, these electrons are ejected with same velocity and can reach the collecting electrode,
c. The frequency of incident light is the same for I1andI2.
Topper's Solved these Questions
- BOOK - NEW JOYTHI PUBLICATIONCHAPTER - DUAL NATURE OF RADIATION AND MATTER EXERCISE - CONTINUOUS EVALUATION (ASSIGNMENT)4videos
DUAL NATURE OF RADIATION AND MATTER
- BOOK - NEW JOYTHI PUBLICATIONCHAPTER - DUAL NATURE OF RADIATION AND MATTER EXERCISE - PREVIOUS YEAR QUESTIONS4videos
DUAL NATURE OF RADIATION AND MATTER
- BOOK - NEW JOYTHI PUBLICATIONCHAPTER - DUAL NATURE OF RADIATION AND MATTER EXERCISE - PRACTICE PROBLEMS FOR SELF ASSESSMENT5videos
DUAL NATURE OF RADIATION AND MATTER
- BOOK - NEW JOYTHI PUBLICATIONCHAPTER - CURRENT ELECTRICITYEXERCISE - COMPETITIVE EXAM CORNER37videos
CURRENT ELECTRICITY
- BOOK - NEW JOYTHI PUBLICATIONCHAPTER - ELECTRIC CHARGES AND FIELDS EXERCISE - Competitive Exam Corner20videos
ELECTRIC CHARGES AND FIELDS
Similar Questions
Discuss the various modes of emission of electron.
03:17View SolutionAlbert Einstein, the great physist proposed a clear picture to explain photoelectric effect.
a. Explain Einstein's photo electric equation.
b. Name the quanta of light.03:34View SolutionWhat is the energy of an α particle that has been accelerated through 50,000 V ?
03:56View SolutionAn electric bulb rated 500 W at 100 V is used in a circuit having a 200 V supply. The resistance R that must be put in series with the bulb, so that the bulb draws 500 W is
08:07View SolutionTwo charged spherical conductors of radii R1andR2 are connected by a wire. Then the ratio of surface charge densitites of the spheres σ1/σ2 is
02:34View SolutionThe curves (a),(b),(c) and (d) show the variation between the applied potential difference (V) and the photoelectric current (i) , at two different intensities of light (I1>I2). In which figure is the correct variation shown ?
02:26View SolutionDraw a plot showing the variation of photoelectric current with collector plate potential for two different frequencies, v1>v2 of incident radiation having the same intensity. In which case will the stopping potential be higher? Justify your answer.
View SolutionPlot a graph showing the variation of photoelectric current with anode potential for two light beam of same wavelength but different intensity.
01:28View SolutionDraw a plot showing the variation of photoelectric current with collector plate potential for two different frequenciesv1andv2(v1>v2) of incident radiation having the same intensity. In which case will the stopping potential be higher? Justify your answer.
02:47View SolutionWhich one of the following graphs in figure shows the variation of photoelectric current (I) with voltage (V) between the electrodes in a photoelectric cell?
04:14View SolutionDraw graphs showing variation of photoelectric current with applied voltage for two incident radiations of equal frequency and different instensities. Mark the graph for the radiation of higher instensity.
03:01View SolutionDraw graphs showing variation of photoelectric current with applied voltage for three incident radiations of equal frequency and different intensities. Mark the graph for the radiation of higher intensity.
03:29View SolutionVariation of photoelectric current with intensity of light is shown by graph…….
View SolutionDraw a plot showing the variation of photoelectric current with collector plate potential for two different frequencies, v1>v2 of incident radiation having the same intensity. In which case will the stopping potential be higher? Justify your answer.
View SolutionDiscuss graphical variation photoelectric current with potential difference in photoelectric cell and explain what information do you get from this graph?
View Solution

