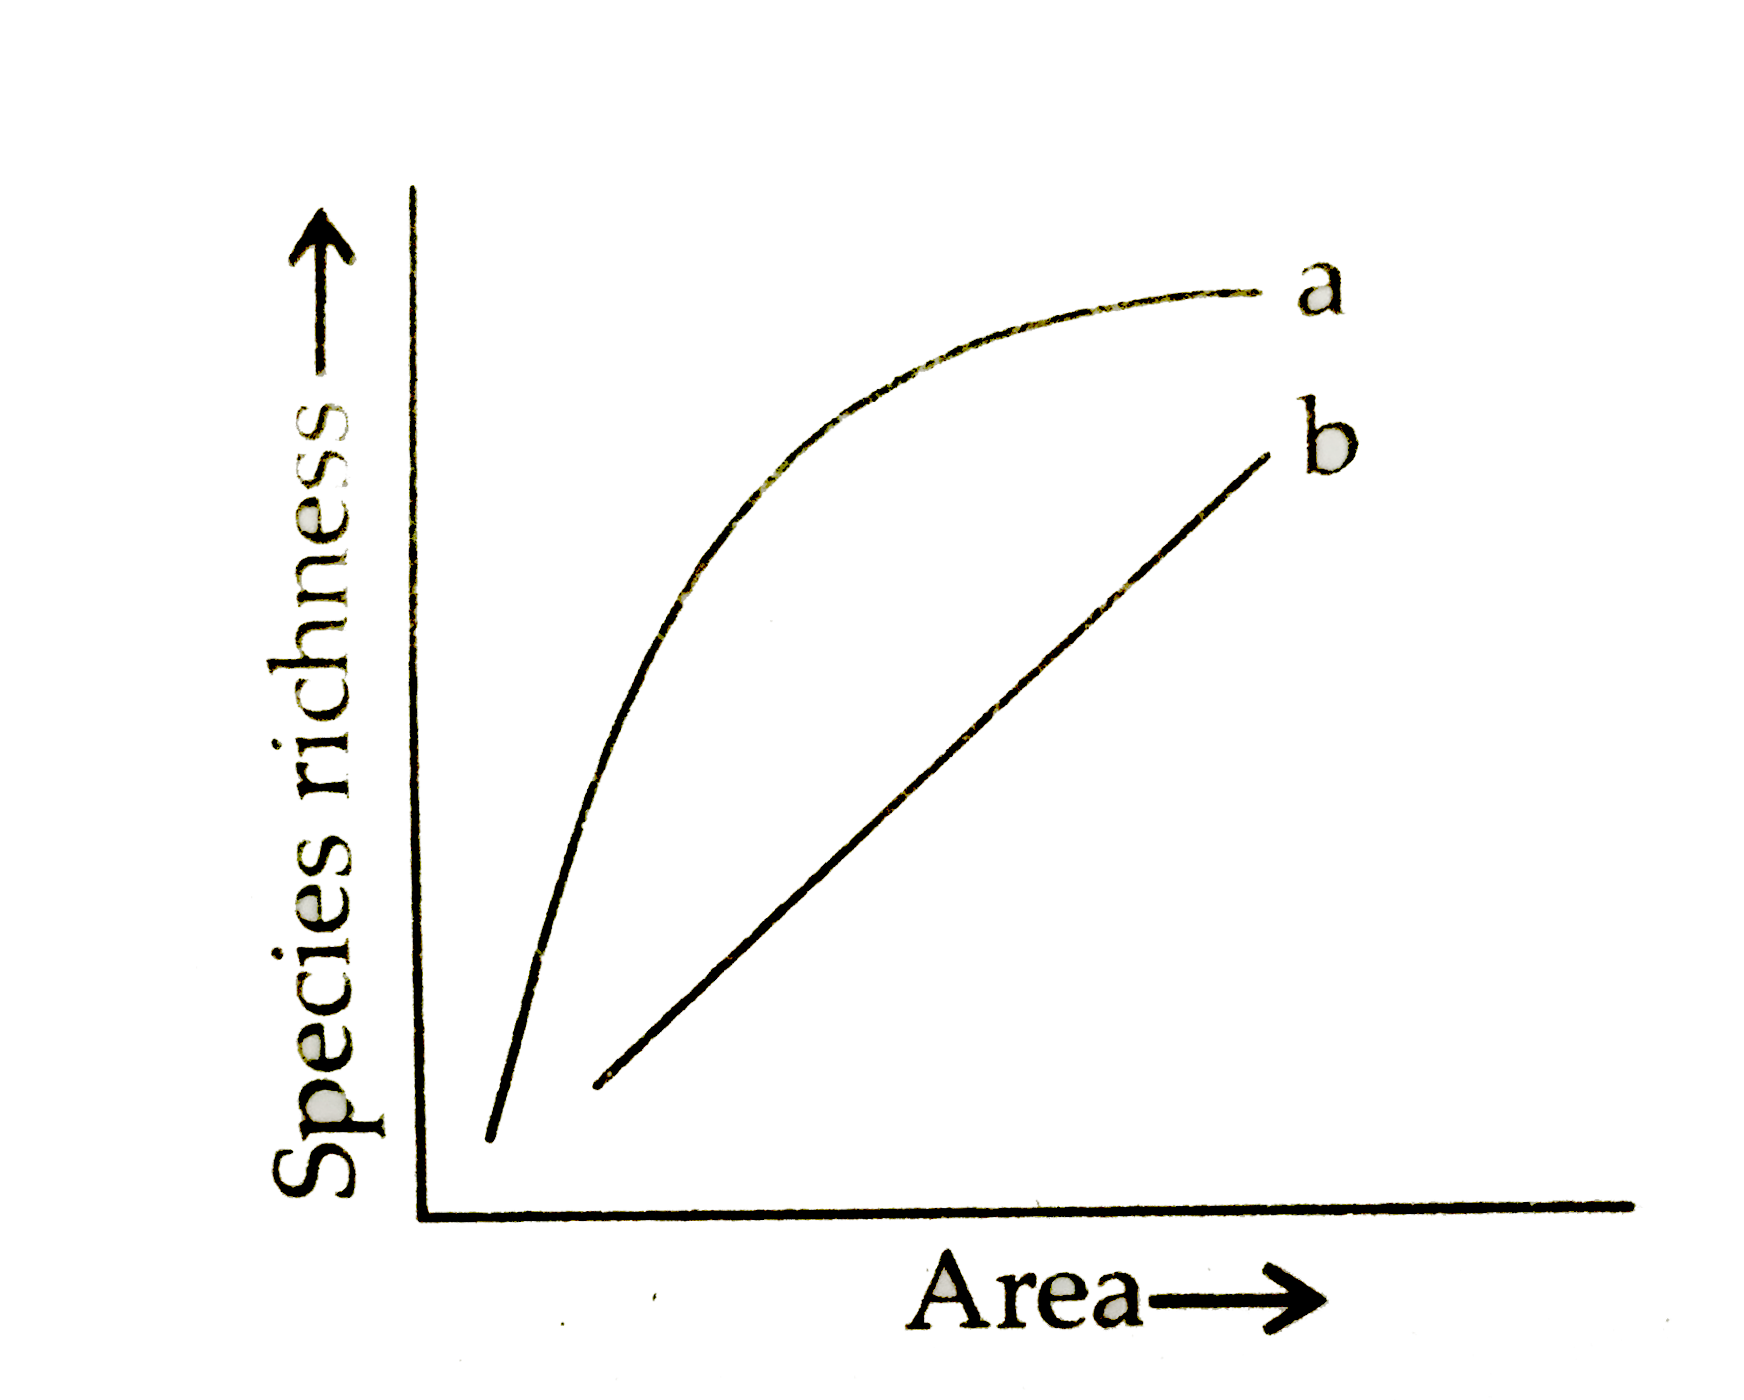
Explain the species area relationship with the help of a diagram?Solution in Tamil
The relationship between species richness and area for a wide variety of taxa (plants, birds, bats, fresh water fishes) will be a rectangular hyberbola in a arithmetic graph. On a logarithmic scale, the relationship is a straight line described by the equation:
Log S = Log C + Z log A
where
S = Species richness
A= Area
Z = Slope of the line
C = Y intercept

Generally the regression coefficients or the slope value of the curve, Z has a value of 0.1- 0.2 regard less of taxonomic group or region. If the area is more like the entire continent, the curve will be more steeper, the Z value being 0.6 - 1.2
Topper's Solved these Questions
- BIODIVERSITY AND ITS CONSERVATIONBook:PREMIERS PUBLISHERSChapter:BIODIVERSITY AND ITS CONSERVATIONExercise:OTHER IMPORTANT QUESTIONS & ANSWERS
Explore 4 Videos
- ASEXUAL AND SEXUAL REPRODUCTION IN PLANTSBook:PREMIERS PUBLISHERSChapter:ASEXUAL AND SEXUAL REPRODUCTION IN PLANTSExercise:OTHER IMPORTANT QUESTIONS & ANSWERS (IV . ANSWER THE FOLLOWING)
Explore 5 Videos
- CLASSICAL GENETICS Book:PREMIERS PUBLISHERSChapter:CLASSICAL GENETICS Exercise:OTHER IMPORTANT QUESTIONS & ANSWERS (IV ANSER THE FOLLOWIN 5 MARKS)
Explore 4 Videos
Similar Questions
Which of the following statement is correct?
View SolutionDescribe the methods of layering.
View SolutionWhat is empirical approach and empirical law ?
View SolutionExplain the relationship between total revenue and marginal revenue with the help of a diagram.
View SolutionExplain the relationship between average variable cost and marginal cost with the help of a diagram.
View SolutionExplain the relationship between TC, TVC and TFC with the help of a hypothetical schedule and diagram.
View SolutionExplain the relationship among TR , AR and MR with the help of a diagrame.
View SolutionExplain the relationship between marginal cost and average variable cost with the help of a diagram.
View SolutionSpecies area relationship was given by :-
View SolutionSpecies-Area relationship was given by
View SolutionThe given graph shows species-area relationship. Write the equation of the curve 'a' and explain.
View SolutionThe above graph show Species-Area relationship. Write the equation of the curve a and explain.
View SolutionSpecies area relationship was given by
View SolutionSpecies - Area Relationship
View SolutionThe Species - Area relationship was given by _________.
View SolutionThe above graph show Species-Area relationship. Write the equation of the curve a and explain.

View Solution
