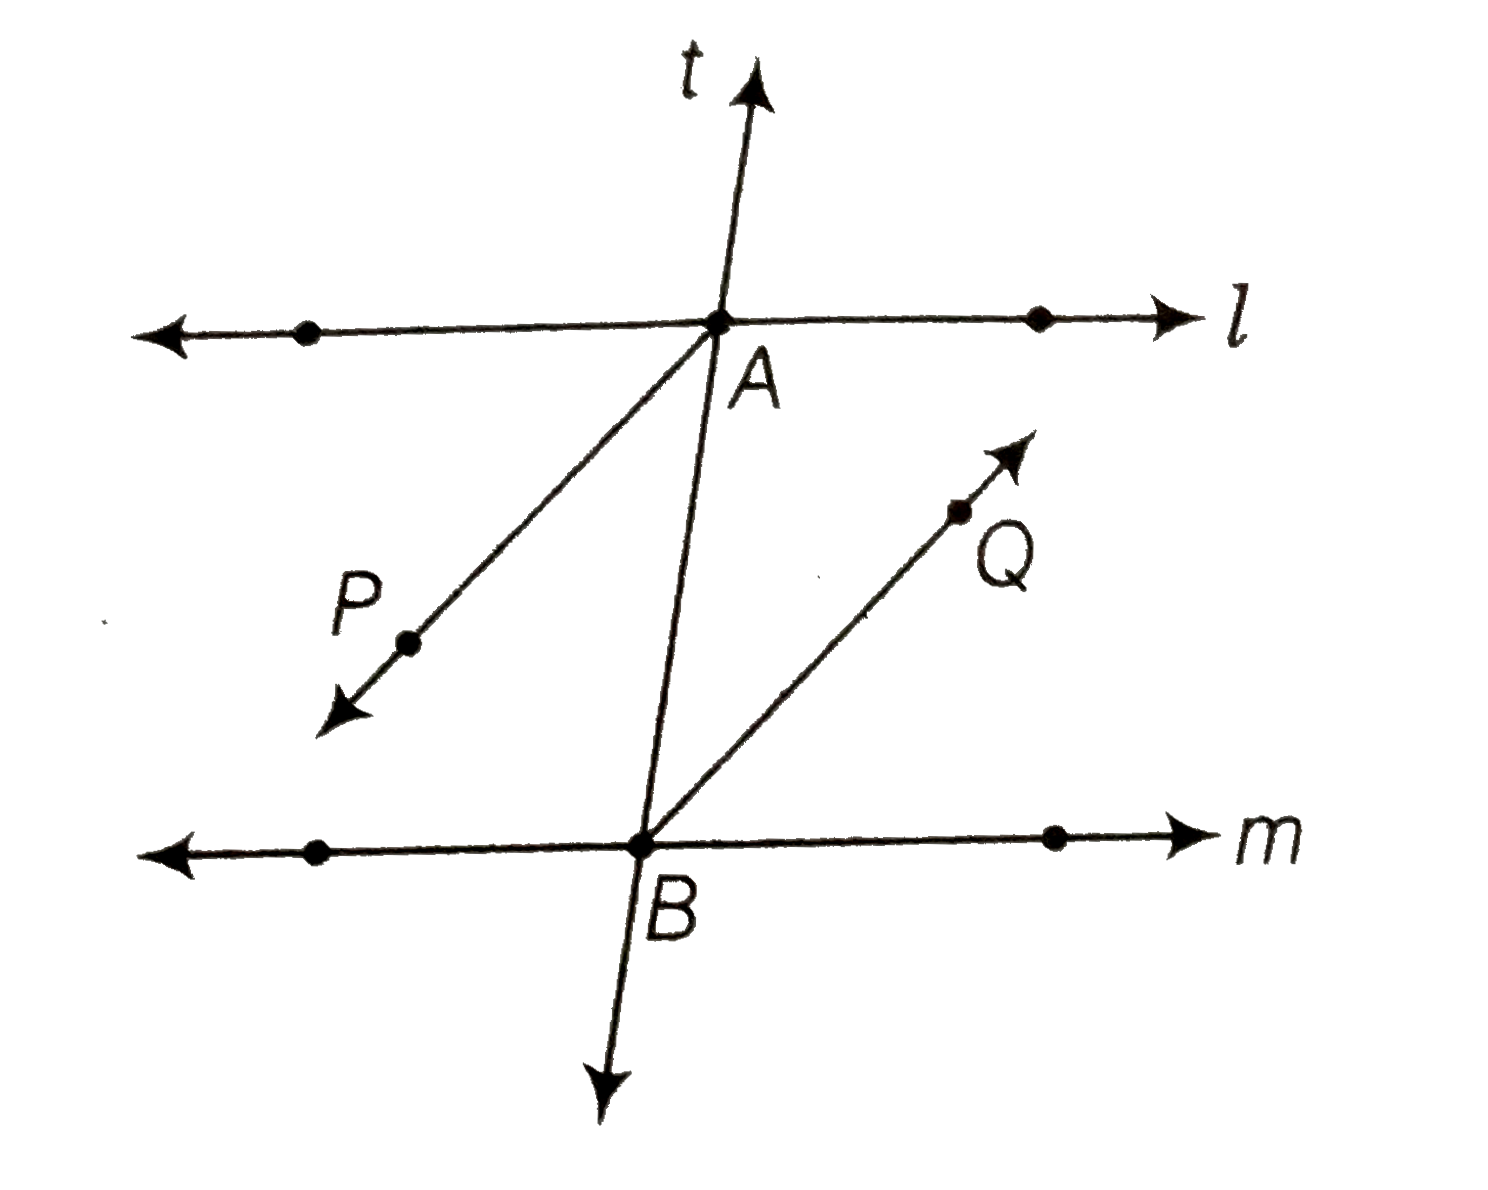
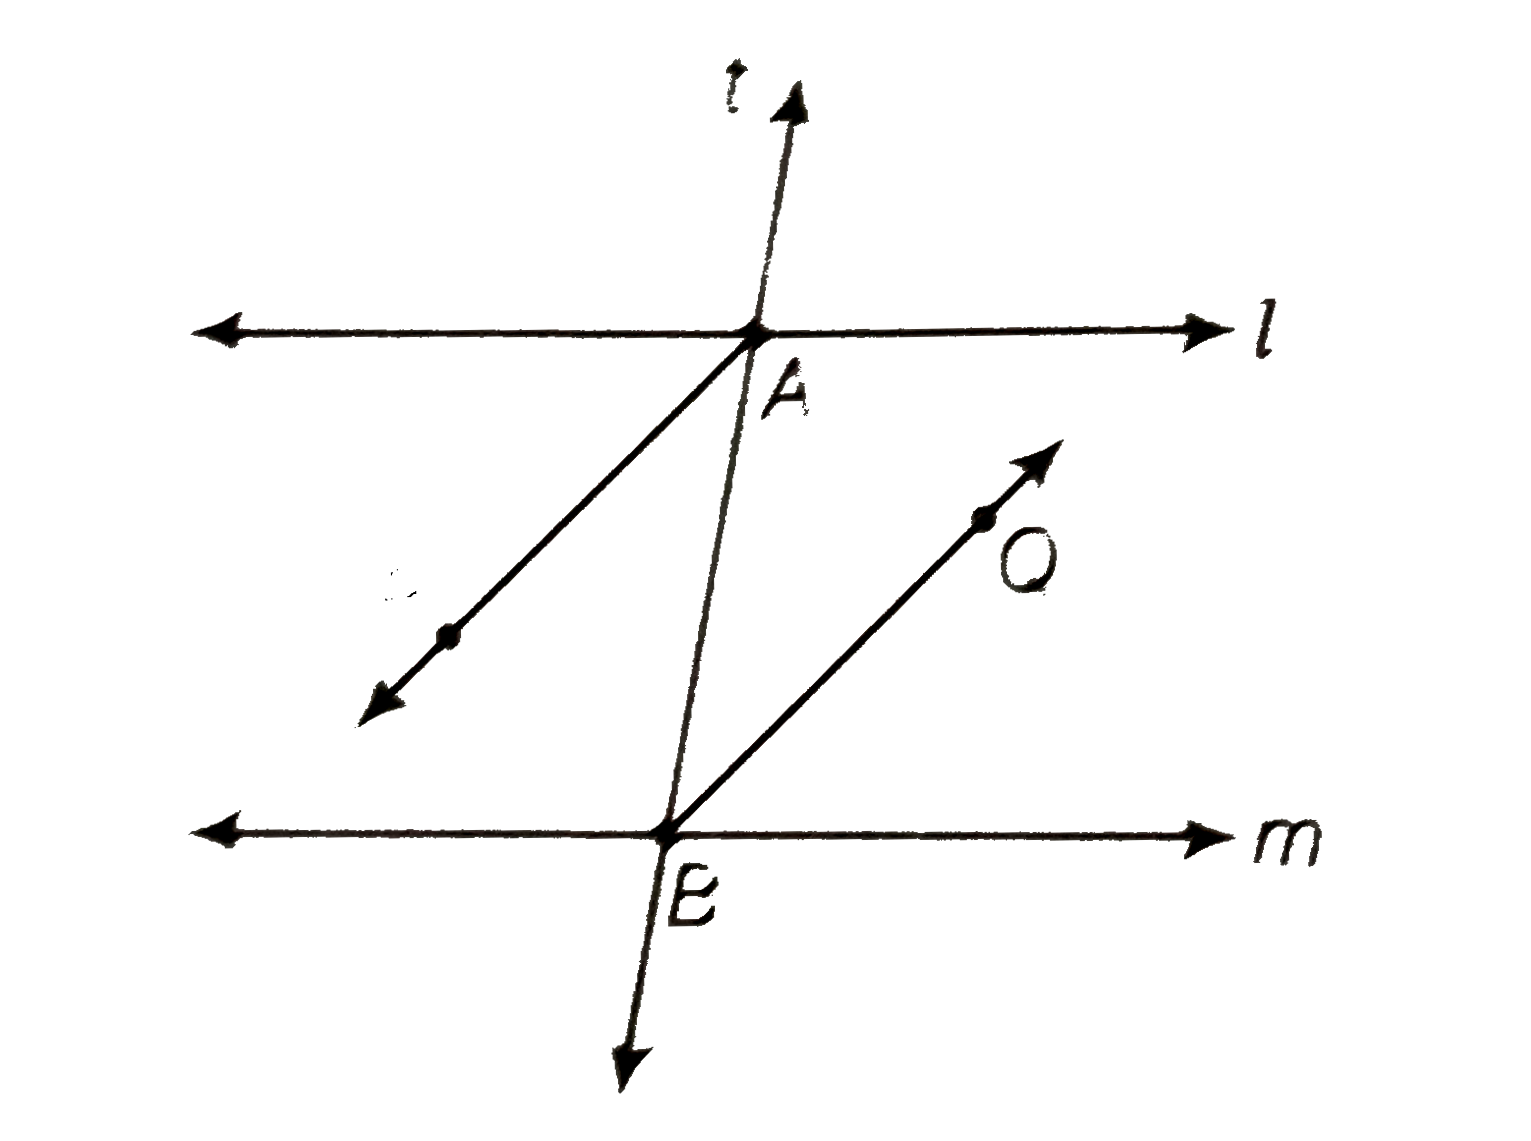
AP and BQ are the bisects of the two alternate interior angles formed by the intersection and a transversal t with parallel lines l and m show in figure, show that AP||BQ
 Solution in Punjabi
Step by step video & image solution for AP and BQ are the bisects of the two alternate interior angles formed by the intersection and a transversal t with parallel lines l and m show in figure, show that AP||BQ by Maths experts to help you in doubts & scoring excellent marks in Class 9 exams.
Updated on:21/07/2023Topper's Solved these Questions
- LINES AND ANGLESBOOK - MODERN PUBLICATIONCHAPTER - LINES AND ANGLESEXERCISE - EXERCISE
151 Videos
- LINEAR EQUATIONS IN TWO VARIABLESBOOK - MODERN PUBLICATIONCHAPTER - LINEAR EQUATIONS IN TWO VARIABLESEXERCISE - EXERCISE
151 Videos
- MODEL TEST PAPER 1BOOK - MODERN PUBLICATIONCHAPTER - MODEL TEST PAPER 1EXERCISE - EXAMPLE
9 Videos
Similar Questions
Find the complement of each of the following angles:
25∘
View SolutionCheck whether of the following are solutions of the equaions 2x-y=8 and which are not:
(0,8)
View SolutionSimplifty : 4√3√(2)2
View SolutionAP and BQ are the bisectors of the two alternate interior angles formed by the intersection of a transversal t with parallel lines l and m (in the given figure). Show that AP||BQ.

View SolutionIn the given figure, bisectors AP and BQ of the alternate interior angles are parallel, then show that l ||m.

View SolutionHow many lines of symmetry does the above figure have ?
View SolutionDetermine the point of symmetry of a regular hexagon.
View SolutionDtermine the images of the following figure about the given line :
View SolutionMatch the following Column A to Column B

View SolutionMatch the following Column A to Column B

View SolutionMatch the following Column A to Column B

View SolutionThe inequation represented by the graph given below is :
View SolutionThe inequation that best describes the graph given below is _________
View SolutionThe inequation that best describes the following graph is _________
View SolutionWhich inequations represent the shaded region in the given figure
View SolutionThe equation of straight line shown in figure is :
ltimg src="https://d10lpgp6xz60nq.cloudfront.net/physics_images/ALN_PHY_R04_E01_020_Q01.png" width="80%"gt
View Solution
