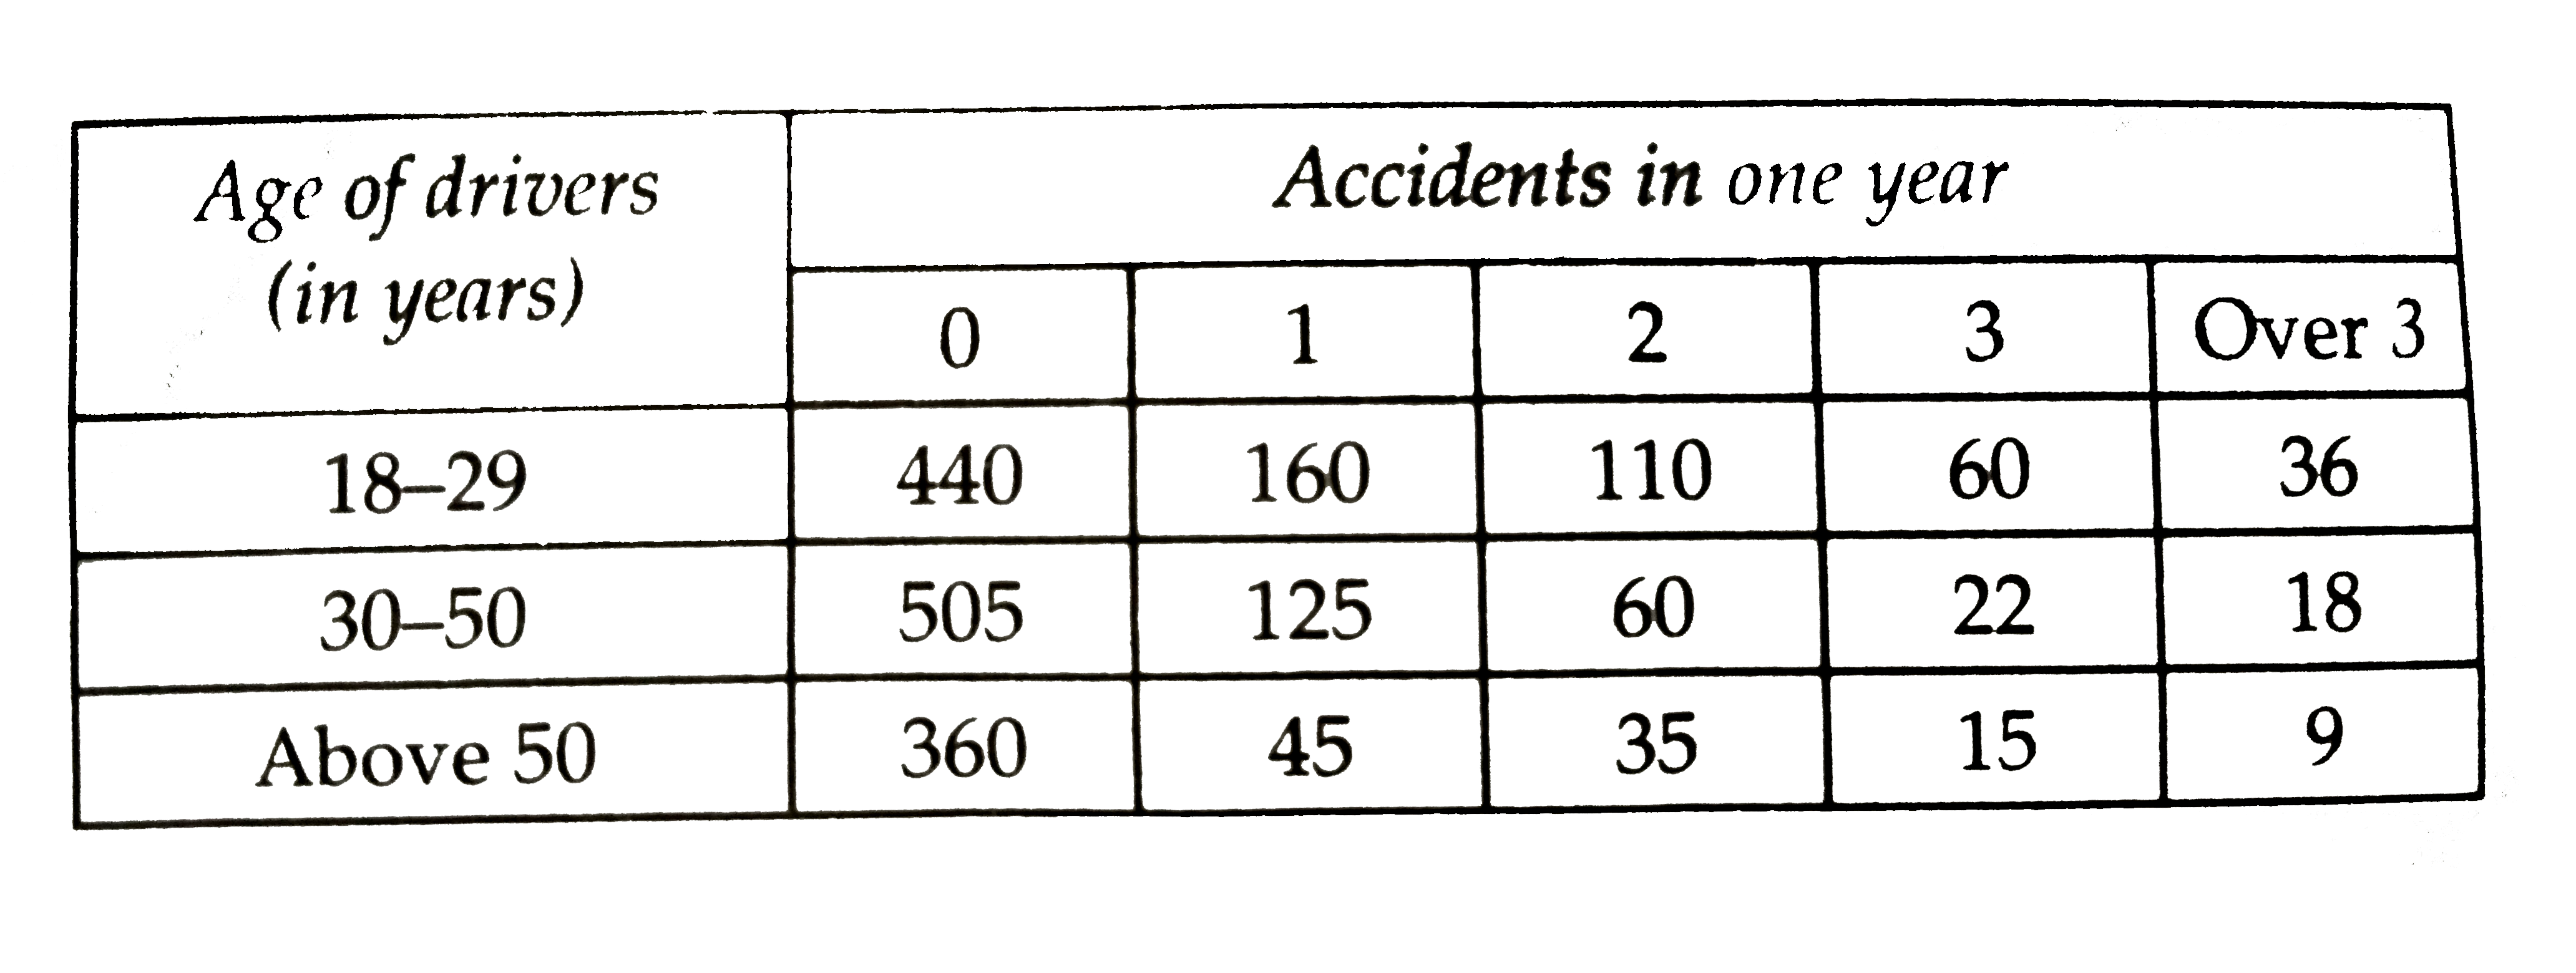
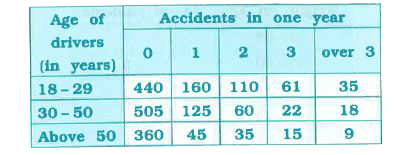
An insurance company selected 2000 drivers at random (i.e., without any preference of one driver over another) in a particular city to find a relationship between age and accidents. The data obtained is given in the following table:

Find the probabilities of the following events for a driver chosen at random from the city:
(i) The driver being in the age group 18-29 years and having exactly 3 accidents in one year.
(ii) The driver being in the age group of 30-50 years and having one or more accidents in a year.
(iii) Having no accidents in the year.Solution in Telugu
The correct Answer is:(i) P=61806, (ii) P=45146, (iii) P=261400
Step by step video, text & image solution for An insurance company selected 2000 drivers at random (i.e., without any preference of one driver over another) in a particular city to find a relationship between age and accidents. The data obtained is given in the following table: Find the probabilities of the following events for a driver chosen at random from the city: (i) The driver being in the age group 18-29 years and having exactly 3 accidents in one year. (ii) The driver being in the age group of 30-50 years and having one or more accidents in a year. (iii) Having no accidents in the year. by Maths experts to help you in doubts & scoring excellent marks in Class 9 exams.
Updated on:21/07/2023Topper's Solved these Questions
- PROBABILITY BOOK - NCERT TELUGUCHAPTER - PROBABILITY EXERCISE - EXAMPLES
10 Videos
- POLYNOMIALS AND FACTORISATION BOOK - NCERT TELUGUCHAPTER - POLYNOMIALS AND FACTORISATION EXERCISE - TRY THESE
6 Videos
- PROOFS IN MATHEMATICSBOOK - NCERT TELUGUCHAPTER - PROOFS IN MATHEMATICSEXERCISE - EXERCISE - 15.4
9 Videos
Similar Questions
If two identical coins are tossed simultaneously. Find (a) the possible outcomes, (b) the number of total outcomes, (c) the probability of getting two heads, (d) probability of getting atleast one head, (e) probability of getting no heads and (f) probability of getting only one head.
View SolutionWrite a polynomial with 2 terms in variable x.
View SolutionState which of the following are mathematical statements and which are not? Give reason.
She has blue rays
View SolutionAn insurance company selected 2000 drivers at random (i.e., without any preference of one driver over another) in a particular city to find a relationship between age and accidents. The data obtained are given in the following table:

Find the probabilities of the following events for a driver chosen at random from the city:
(i) being 18-29 years of age and having exactly 3 accidents in one year.
(ii) being 30-50 years of age and having one or more accidents in a year.
(iii) having no accidents in one year
View SolutionAn insurance company selected 2000 drivers at random in particular city to find a relationship between age and accidents . The data obtained are given in the following table .
Find the probability of each of the following events for a driver chosen at random from the city :
(i) being 18−29 years of age and having exactly 3 accidents in one year .
(ii) being 30−50 years of age and having one or more accidents in one year
(iii) having no accident in one year .
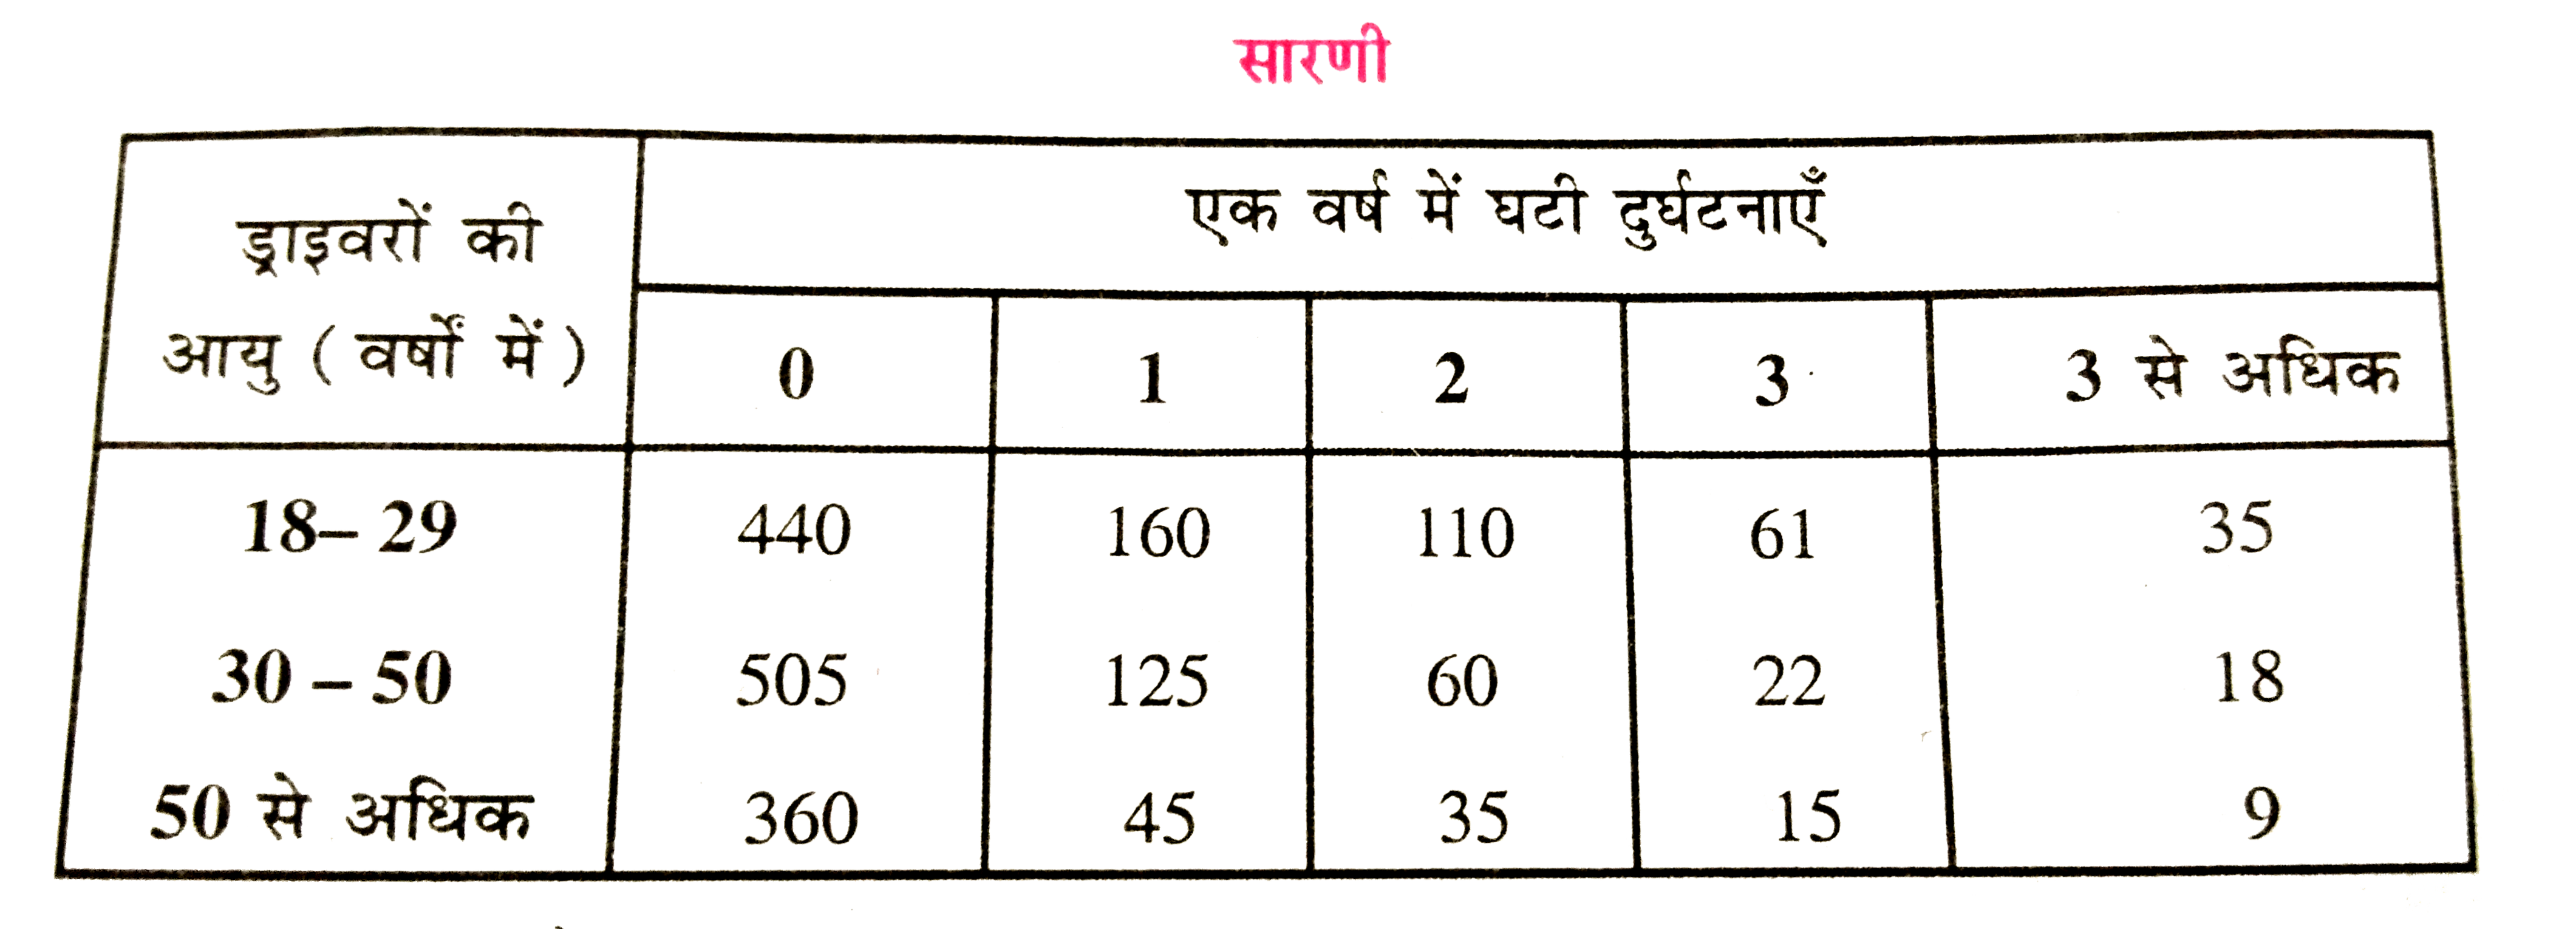
View Solutionएक बीमा कंपनी ने आयु और दुर्घटनाओं के बीच के संबंध को ज्ञात करने के लिए के विशेष नगर के 2000 ड्राइवरों का यदृच्छया चयन किया ( किसी ड्राइवर को कोई विशेष वरीयता दिए बिना ) । प्राप्त किए गए आंकड़ें नीचे सारणी में दिए गए हैं :

नगर से यदृच्छया चुने गए एक ड्राइवर के लिए निम्नलिखित घटनाओं कि प्रायिकताएँ ज्ञात कीजिए :
(i ) 18-29 वर्ष की आयु का जिसके साथ एक वर्ष में ठीक - ठीक 3 दुर्घटनाएँ घटी हैं ।
( ii) 30-50 वर्ष कि आयु का जिसके साथ एक वर्ष में एक या अधिक दुर्घटनाएँ घटी हैं ।
(iii ) जिसके साथ एक वर्ष में कोई दुर्घटना नहीं घटी ।
View Solutionएक बीमा कंपनी ने आयु और दुर्घटनाओं के बीच के संबंध को ज्ञात करने के लिए एक विशेष नगर के 2000 ड्राइवरों का यदृच्छया चयन किया (किसी ड्राइवर को कोई विशेष वरीयता दिय बिना)। कुछ किए गए आँकड़े नीचे सारणी में दिय गए है :
नगर से यादृच्छया चुने गए एक ड्राइवर के लिए निम्नलिखित घटनाओं की प्रायिकताएँ ज्ञात कीजिए:
(i) 18 - 29 वर्ष की आयु का जिसके साथ एक वर्ष में ठीक-ठीक 3 दुर्घटनाएँ घटी है।
(ii) 30 - 50 वर्ष की आयु का जिसके साथ एक वर्ष में एक या अधिक दुर्घटनाएँ घटी है।
(iii) जिसके साथ एक वर्ष में कोई दुर्घटना नहीं घटी है।
View SolutionAn insurance company selected 2000 drivers at random (i.e., without any preference of one driver over another) in a particular city to find a relationship between age and accidents. The data obtained is given in the following table: Find the probabilities of the following events for a driver chosen at random from the city: (i) The driver being in the age group 18-29 years and having exactly 3 accidents in one year. (ii) The driver being in the age group of 30-50 years and having one or more accidents in a year. (iii) Having no accidents in the year.
View SolutionAn insurance company selected 2000 drivers at random (i.e., without any preference of one driver over another) in a particular city to find a relationship between age and accidents. The data obtained is given in the following table: Find the probabilities of the following events for a driver chosen at random from the city: (i) The driver being in the age group 18-29 years and having exactly 3 accidents in one year. (ii) The driver being in the age group of 30-50 years and having one or more accidents in a year. (iii) Having no accidents in the year.
View SolutionAn insurance company selected 2000 drivers at random (i.e., without any preference of one driver over another) in a particular city to find a relationship between age and accidents. The data obtained is given in the following table:

Find the probabilities of the following events for a driver chosen at random from the city:
(i) The driver being in the age group 18-29 years and having exactly 3 accidents in one year.
(ii) The driver being in the age group of 30-50 years and having one or more accidents in a year.
(iii) Having no accidents in the year.
View SolutionAn insurance company selected 2000 drivers at random (i.e., without any preference of one driver over another) in a particular city to find a relationship between age and accidents. The data obtained is given in the following table:

Find the probabilities of the following events for a driver chosen at random from the city:
(i) The driver being in the age group 18-29 years and having exactly 3 accidents in one year.
(ii) The driver being in the age group of 30-50 years and having one or more accidents in a year.
(iii) Having no accidents in the year.
View SolutionAn insurance company selected 2000 drivers at random (i.e., without any preference of one driver over another) in a particular city to find a relationship between age and accidents. The data obtained are given in the following table:A g e\ o
View SolutionAn insurance company selected 2000 drivers at random (i.e., without any preference of one driver over another) in a particular city to find a relationship between age and accidents. The data obtained are given in the following table: Find the probabilities of the following events for a driver chosen at random from the city: (i) The driver being in the age group 18−29 years and having exactly 3 accidents in one year. (ii) The driver being in the age group of 30−50 year and having one or more accidents in a year. (iii) The number of drivers having no accidents in one year
View SolutionAn insurance company selected 2000 drivers at random (i.e., without any preference of one driver over another) in a particular city to find a relationship between age and accidents . The data obtained are given in following table :
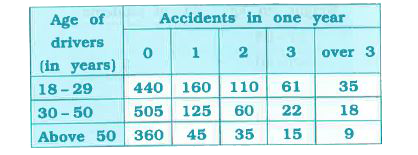
Find the probabilities of the following events for a driver chosen at random from the city.
being 18-29 years of age and having exactly 3 accidents in one year.
View SolutionAn insurance company selected 2000 drivers at random (i.e., without any preference of one driver over another) in a particular city to find a relationship between age and accidents . The data obtained are given in following table :
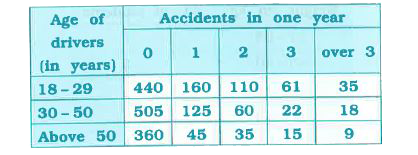
Find the probabilities of the following events for a driver chosen at random from the city.
being 30-50 years of age and having one or more accidents in a year.
View SolutionAn insurance company selected 2000 drivers at random (i.e., without any preference of one driver over another) in a particular city to find a relationship between age and accidents . The data obtained are given in following table :
Find the probabilities of the following events for a driver chosen at random from the city.
having no accidents in one year
View Solution
