A survey asked a group of 1000 people what type of bread they like best. The table below shows their preferences.
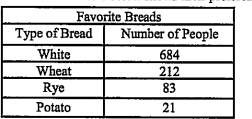
Which one of the following graphs best represents the data in this table?
A
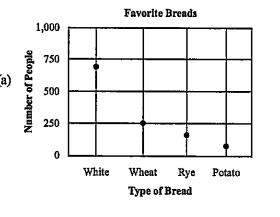
B
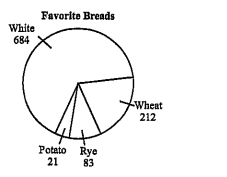
C
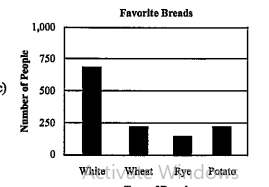
D
NONE OF THESE
Text Solution
The correct Answer is:B
|
Similar Questions
Knowledge Check
Which of the following graphs best represents the motion of a raindrop?
A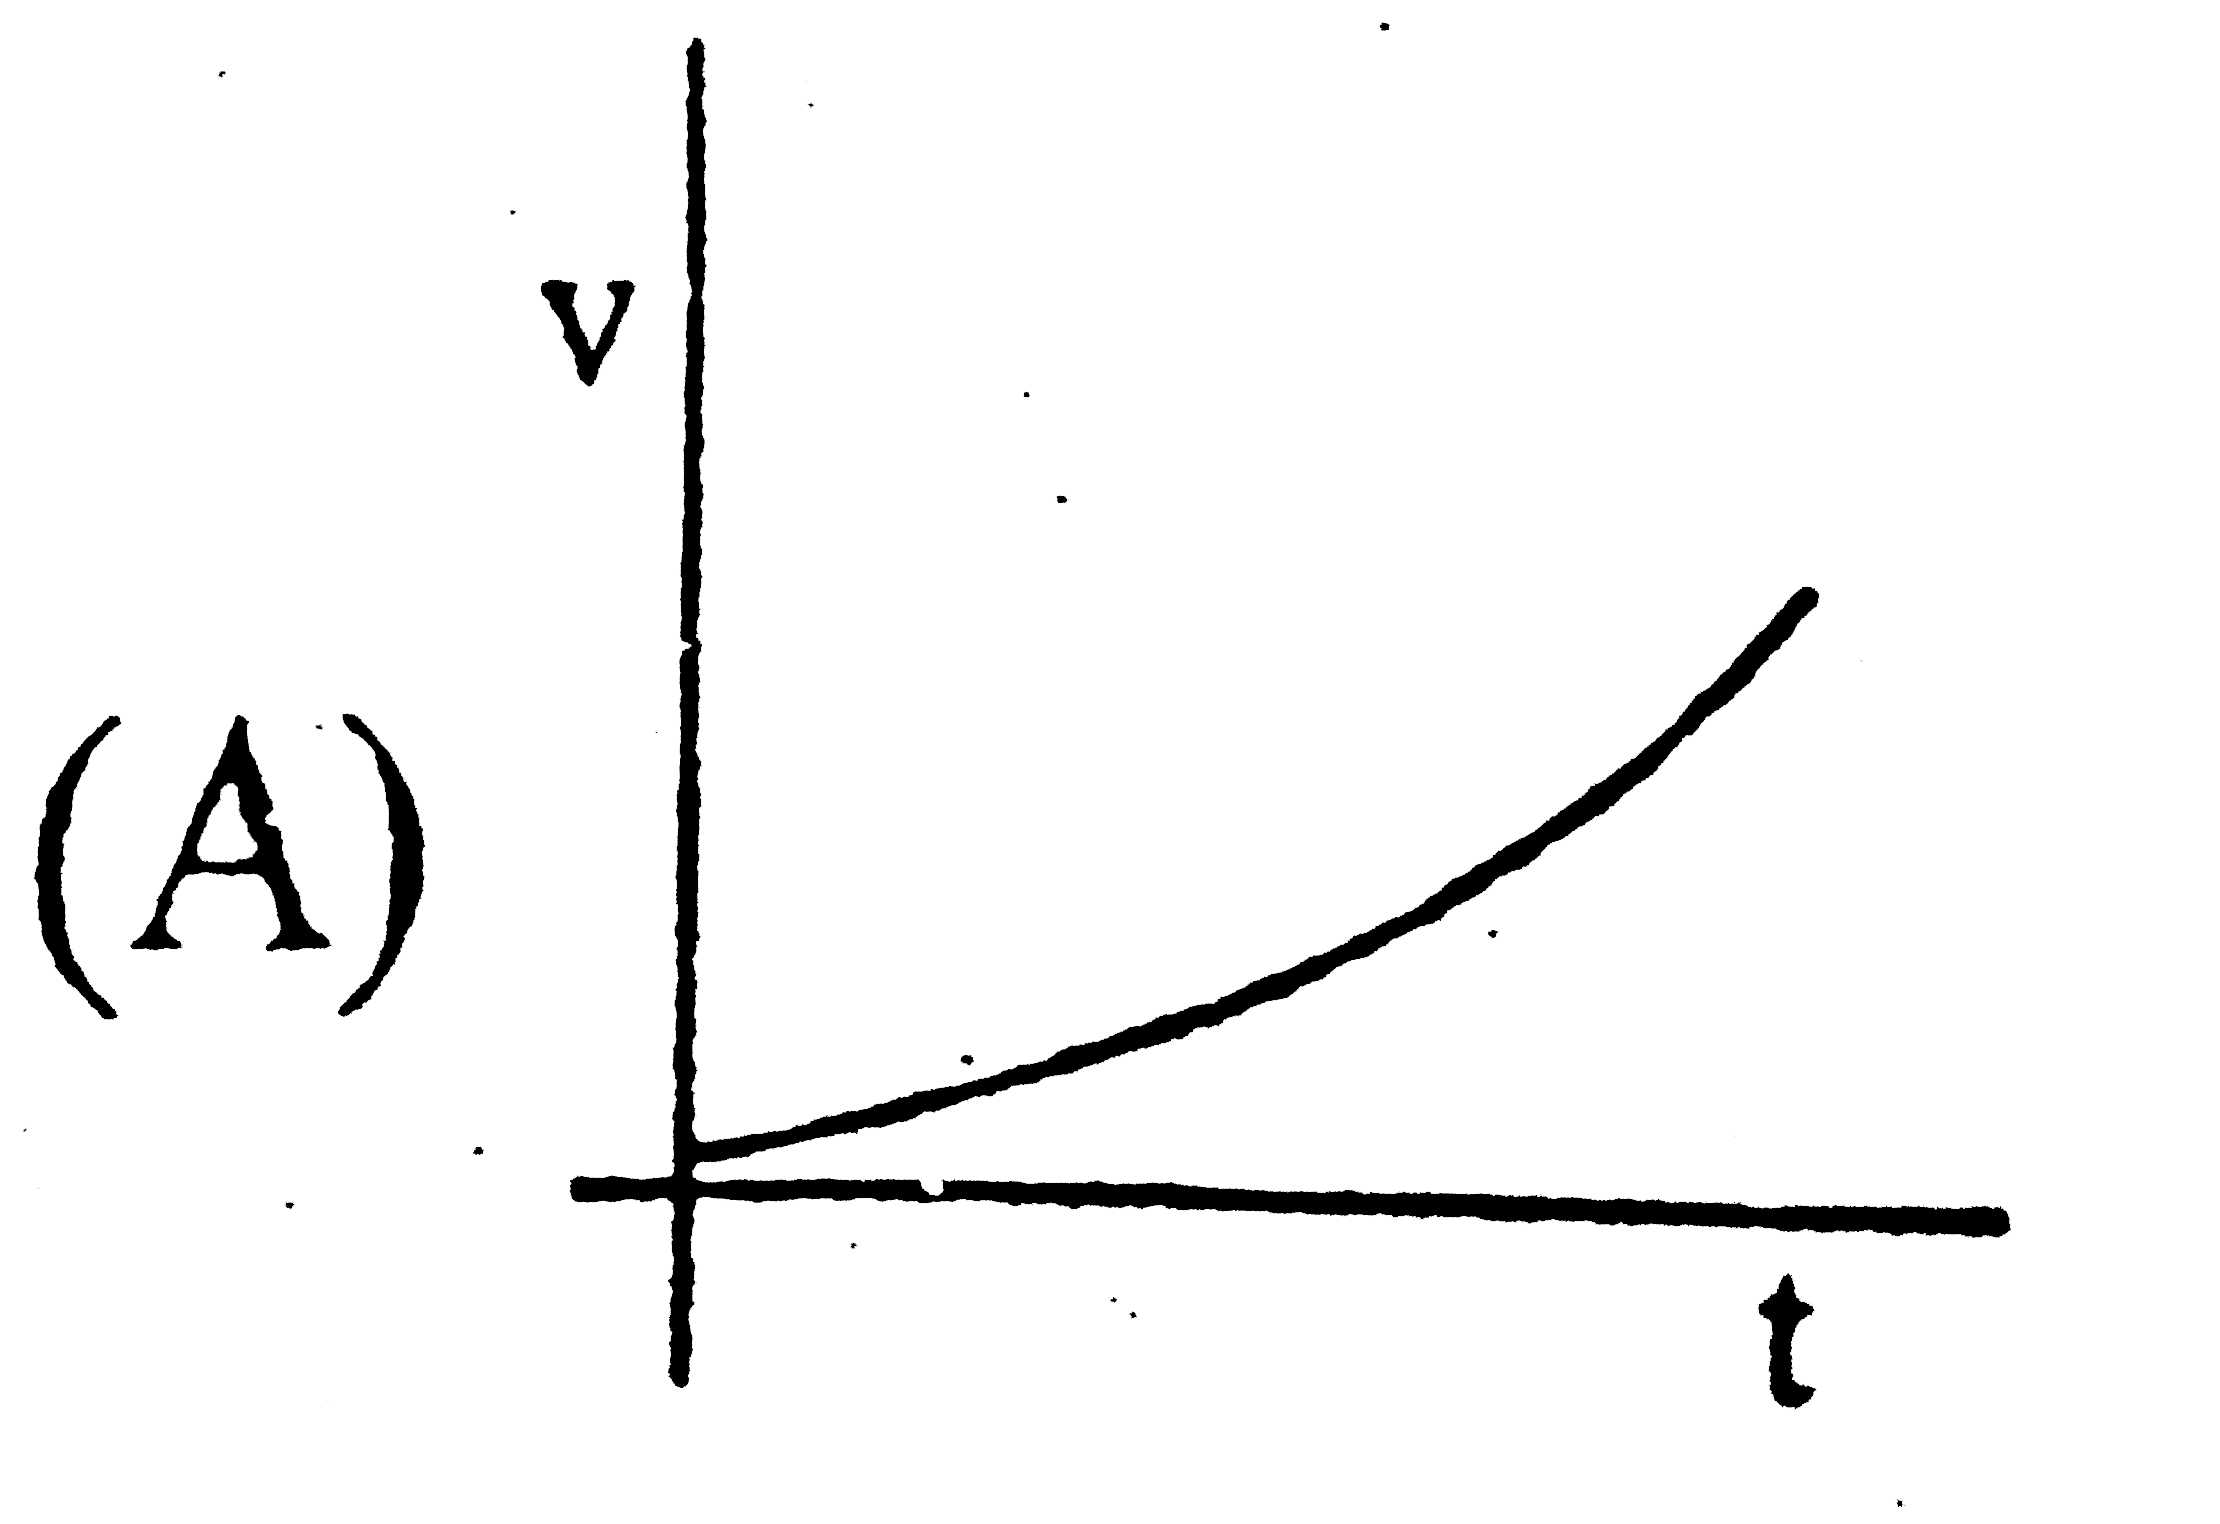 B
B C
C D
D
Which one of the following belongs to representative group of elements in the periodic table?
AaluminiumBchromiumCargonDlanthanumWhich one of the following belongs to representative group of elements in the periodic table?
AAluminiumBArgonCchromiumDLanthanum
Which one of following best represents the graph of y=xlogxπ
View SolutionWhich one of the following best represent the graph of function f(x)=e{|x|}
View Solution29. Which one of following best represents the graph of y=xlogxπ
View SolutionWhich graphs of the following represent the table below?
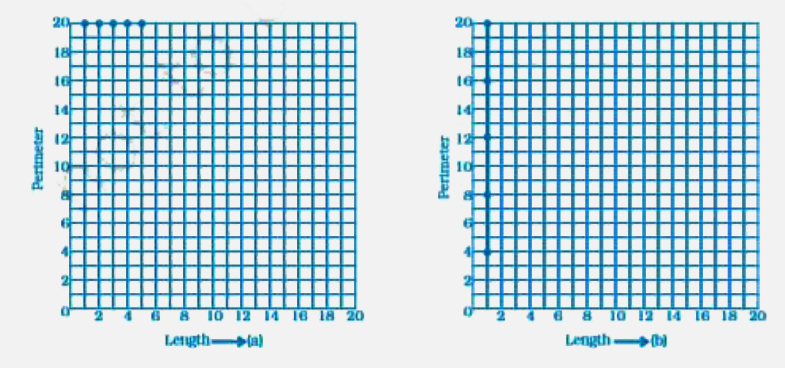
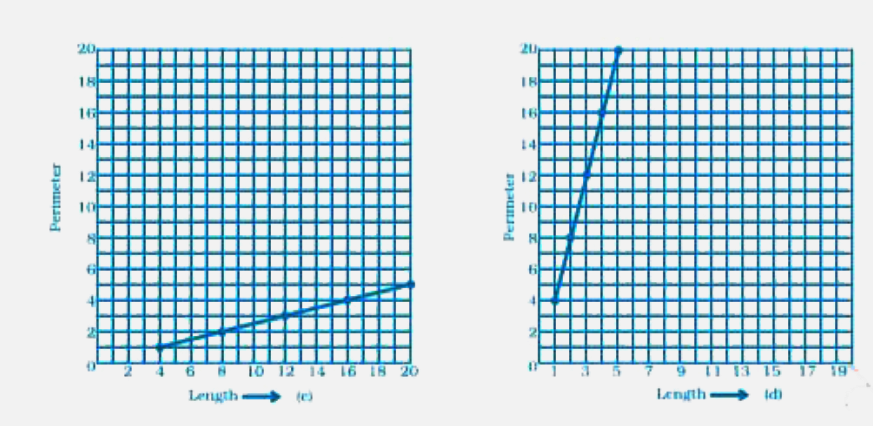
View SolutionWhich of the following graphs best represents the variation of acceleration 'a' with displacement x?
View Solution

