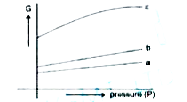
The following curve represents the variation of Gibbs function 'G' with pressure at constant temperature. Correct match of given plots with the physical state of a substance is

c − solid, a- gas, b- liquid
c- gas, b- liquid, a- solid
a- liquid, b- solid, c- gas
c- gas, b- solid, a - liquid
The correct Answer is:B
Step by step video & image solution for The following curve represents the variation of Gibbs function 'G' with pressure at constant temperature. Correct match of given plots with the physical state of a substance is by Chemistry experts to help you in doubts & scoring excellent marks in Class 12 exams.
Updated on:21/07/2023Similar Questions
Knowledge Check
Which law states that "product of volume and pressure at constant temperature is constant for a dry gas of given mass".
ACharles.s lawBBoyle.s lawCHenry.s lawDDalton.s law
Which of the following graphs correctly represents the variation of β=−dV/dPV
with P for an ideal gas at constant temperature?
View SolutionWhich of the following graphs correctly represents the variation of β=−dV/dPV
with P for an ideal gas at constant temperature?
View SolutionWhich of the following graphs correctly represents the variation of β=−(dVdP)/V with P for an ideal gas at constant temperature
View SolutionWhich of the following represents correctly the variation of degree of adsorption against temperature for physical adsorption ?
View SolutionPlots showing the variation of the rate constant (k) with temperature (T) are given below. The plot that follows the Arrhenius equation is
View SolutionWhich of the following graph represents the variation of amount of chemisorption of a gas by a solid with temperature under constant pressure?
View SolutionWhich of the following curves obtained at constant temperature and for a given mass of a gas is not a straight line ?
View Solution
