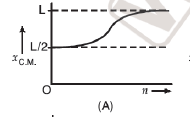
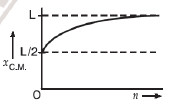
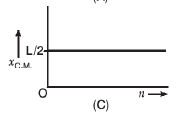
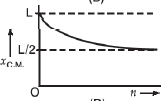
A thin rod of length L is lying along the x-axis with its ends at x = 0 and x = L. Its linear density (mass/length) varies with x as k(xL)n where n can be zero or any positive number. If the position XCM of the centre of mass of the rod is plotted against n, which of the following graphs best approximates the dependence of XCM on n?Solution in Punjabi


Step by step video & image solution for A thin rod of length L is lying along the x-axis with its ends at x = 0 and x = L. Its linear density (mass/length) varies with x as k((x)/(L))^n where n can be zero or any positive number. If the position X_(CM) of the centre of mass of the rod is plotted against n, which of the following graphs best approximates the dependence of X_(CM) on n? by Physics experts to help you in doubts & scoring excellent marks in Class 11 exams.
Updated on:21/07/2023Topper's Solved these Questions
- Moment of InertiaBOOK - MODERN PUBLICATIONCHAPTER - Moment of InertiaEXERCISE - Example
323 Videos
- Gravitational potential and potential energyBOOK - MODERN PUBLICATIONCHAPTER - Gravitational potential and potential energyEXERCISE - Exercise
17 Videos
- Motion of SatellitesBOOK - MODERN PUBLICATIONCHAPTER - Motion of SatellitesEXERCISE - Exercise
25 Videos
Similar Questions
The moment of inertia of a thin rod about an axis passing through its centre and perpendicular to its length is 1,200gcm2. If length of the rod is 20 cm, find its moment of inertia about an axis passing through its one end and perpendicular to its length.
View SolutionWhat do you understand by gravitational field?
View SolutionDefine orbital velocity of a satellite. Obtain an expression for orbital velocity of a satellite.
View SolutionA rod of length L is placed along the x-axis between x=0 and x=L . The linear mass density (mass/length) rho of the rod varies with the distance x from the origin as rho=a+bx . Here, a and b are constants. Find the position of centre of mass of this rod.
View SolutionA thin rod of length 6 m is lying along the x-axis with its ends at x=0 and x=6m. Its linear density *mass/length ) varies with x as kx4. Find the position of centre of mass of rod in meters.
View SolutionL लम्बाई की एक पतली छड़ X-अक्ष के अनुदिश रखी है। उसके सिरे x = 0 तथा x = L पर हैं। इसका रैखिक घनत्व (द्रव्यमान/लम्बाई) x के साथ K(xL)n के अनुसार परिवर्तित होता है, जहाँ n शून्य अथवा कोई भी धनात्मक संख्या हो सकती है। यदि छड़ के द्रव्यमान-केन्द्र xm को n के विरुद्ध आलेखित किया जाये तब निम्नलिखित में से कौन-सा ग्राफ xm की n पर निर्भरता का उत्तम सन्निकट है?
View SolutionA rod of length L is placed along the x-axis between x = 0 and x = L. The linear density (mass/length) lamda of the rod varies with the distance x from the origin as lamda = Rx. Here, R is a positive constant. Find the position of centre of mass of this rod.
View SolutionA rod of length L is placed along the x-axis between x = 0 and x = L. The linear density (mass/ length) lambda of the rod varies with the distance x from the origin as lambda = Rx . Here, R is a positive constant. Find the position of centre of mass of this rod.
View SolutionA non–uniform thin rod of length L is placed along x-axis as such its one of ends at the origin. The linear mass density of rod is lambda=lambda_(0)x . The distance of centre of mass of rod from the origin is :
View SolutionA thin rod of length L is lying along the x-axis with its ends at x = 0 and x = L. Its linear density (mass/length) varies with x as k(xL)n where n can be zero or any positive number. If the position XCM of the centre of mass of the rod is plotted against n, which of the following graphs best approximates the dependence of XCM on n?
View SolutionA thin rod length 'L' is lying along the x-axis with its ends at x=0 and x=L . Its linear density (mass/length) varies with x as k (x^(n))/(L) , where n can be zero or any positive number. If the position x_(CM) of the centre of mass of the rod is plotted against 'n', which of the following graphs best approximates the dependence of x_(CM) on n?
View SolutionA thin rod of length L is lying along the x-axis with its ends at x=0 and x=L its linear (mass/length) varies with x as k(xL)n, where n can be zero of any positive number. If to position xCM of the centre of mass of the rod is plotted against 'n', which of the following graphs best apporximates the dependence of xCM on n?
View SolutionA thin rod of length L is lying on the X-axis with its end at x = 0 and x = L. Its linear density varies with x as K(x/L)^(n) , where n can be zero or any positive number. If the position of centre of mass of the rod is plotted against .n. which of the following graph best approximates the dependence of X_("cm") on n ?
View SolutionA thin rod of length L is lying along the x-axis with its ends at x = 0 and x = L. Its linear density (mass/length) varies with x as k(xL)n where n can be zero or any positive integer. If position Xcm of centre of mass of the rod is plotted against n, which of the following graphs best approximates the dependence of xCM on n?
View SolutionA thin rod of length L is placed along the x-axis with its ends at x = 0 and x = L. Its linear density (mass / length) k ((x)/(L))^(n) With x, where n can be zero or any positive number. If the position of the center of mass of the rod x_(CM), n Which of the following diagrams is denoted against x_(CM) Represents the dependence of?
View SolutionA rod of length L is placed along the x-axis between x=0 and x=L . The linear mass density (mass/length) rho of the rod varies with the distance x from the origin as rho=a+bx . Here, a and b are constants. Find the position of centre of mass of this rod.
View Solution
