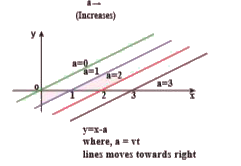
Sketch y = x -a for different values of a.
Text Solution

This implies, when increasing the value of a, the line shifts towards right side. For a = vt, y = x - vt satisfies the differential equation. Though this function satisfies. the differential equation, it is not finite for all values of x and t. Hence, it does not represent a wave.
|
Topper's Solved these Questions
- WAVESBOOK - NCERT TAMILCHAPTER - WAVESEXERCISE - EVALUATION(I. MULTIPLE CHOICE QUESTIONS)
15 Videos
- WAVESBOOK - NCERT TAMILCHAPTER - WAVESEXERCISE - EVALUATION(IV. NUMERICAL PROBLEMS)
7 Videos
- WAVESBOOK - NCERT TAMILCHAPTER - WAVESEXERCISE - EVALUATION(IV. NUMERICAL PROBLEMS)
7 Videos
- UNITS AND MEASUREMENTBOOK - NCERT TAMILCHAPTER - UNITS AND MEASUREMENTEXERCISE - EXERCISE (ADDITIONAL EXERCISE)
9 Videos
- WORK, ENERGY AND POWERBOOK - NCERT TAMILCHAPTER - WORK, ENERGY AND POWEREXERCISE - EXERCISE - IV. NUMERICAL PROBLEMS
5 Videos
Similar Questions
Sketch the graph for y=|sinx|.
View Solutionsketch [y]=[sinx]
View SolutionThe sketch shows part of the graph y=alog2(x−b). Find the values of a and b.

View SolutionSketch the graph of y=3x
View SolutionSketch the graph : y=3sinx
View SolutionSketch the graph : y=2tanx
View SolutionSketch the graph : y=3sinx
View SolutionSketch the graph : y=2tanx
View SolutionA sketch of the graph y=alog4(x+b) is shown. Find the values of a and b.

View SolutionSketch the graph for y=x2−x.
View Solution
