Line graph given below shows percentage of defective article out of total manufactured/1 article in five different company i.e. (A, B, C, D and E).
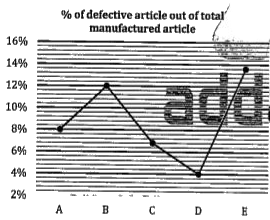
No. of defective article manufactured by company A is 96. Find total no. of article manufactured by company A?
9600
1200
1600
8000
The correct Answer is:B
Step by step video, text & image solution for Line graph given below shows percentage of defective article out of total manufactured/1 article in five different company i.e. (A, B, C, D and E). No. of defective article manufactured by company A is 96. Find total no. of article manufactured by company A? by Maths experts to help you in doubts & scoring excellent marks in Class 14 exams.
Updated on:21/07/2023Topper's Solved these Questions
- DATA INTERPRETATIONBOOK - ADDA247CHAPTER - DATA INTERPRETATIONEXERCISE - Prelims Questions (Level-1)
54 Videos
- DATA INTERPRETATIONBOOK - ADDA247CHAPTER - DATA INTERPRETATIONEXERCISE - Prelims Questions (Level-2)
59 Videos
- DATA INTERPRETATIONBOOK - ADDA247CHAPTER - DATA INTERPRETATIONEXERCISE - Previous Year Questions
56 Videos
- BOAT AND STREAM BOOK - ADDA247CHAPTER - BOAT AND STREAM EXERCISE - Previous Year Question
22 Videos
- DATA SUFFICIENCY BOOK - ADDA247CHAPTER - DATA SUFFICIENCY EXERCISE - PREVIOUS YEAR QUESTIONS
25 Videos
Similar Questions
The table given below shows the information about bats manufactured by 6 different companies. Each company labels these bats as Brand A or Brand B. The table shows the number of plastic bats as a percentage of total bats manufactured by each company. It also shows the ratio of wooden bats labeled A and B. Each company manufactured a total of 550,000 bats.
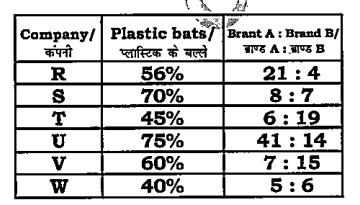 What is the total number of wooden bats of brand A manufactured by company T ?
View Solution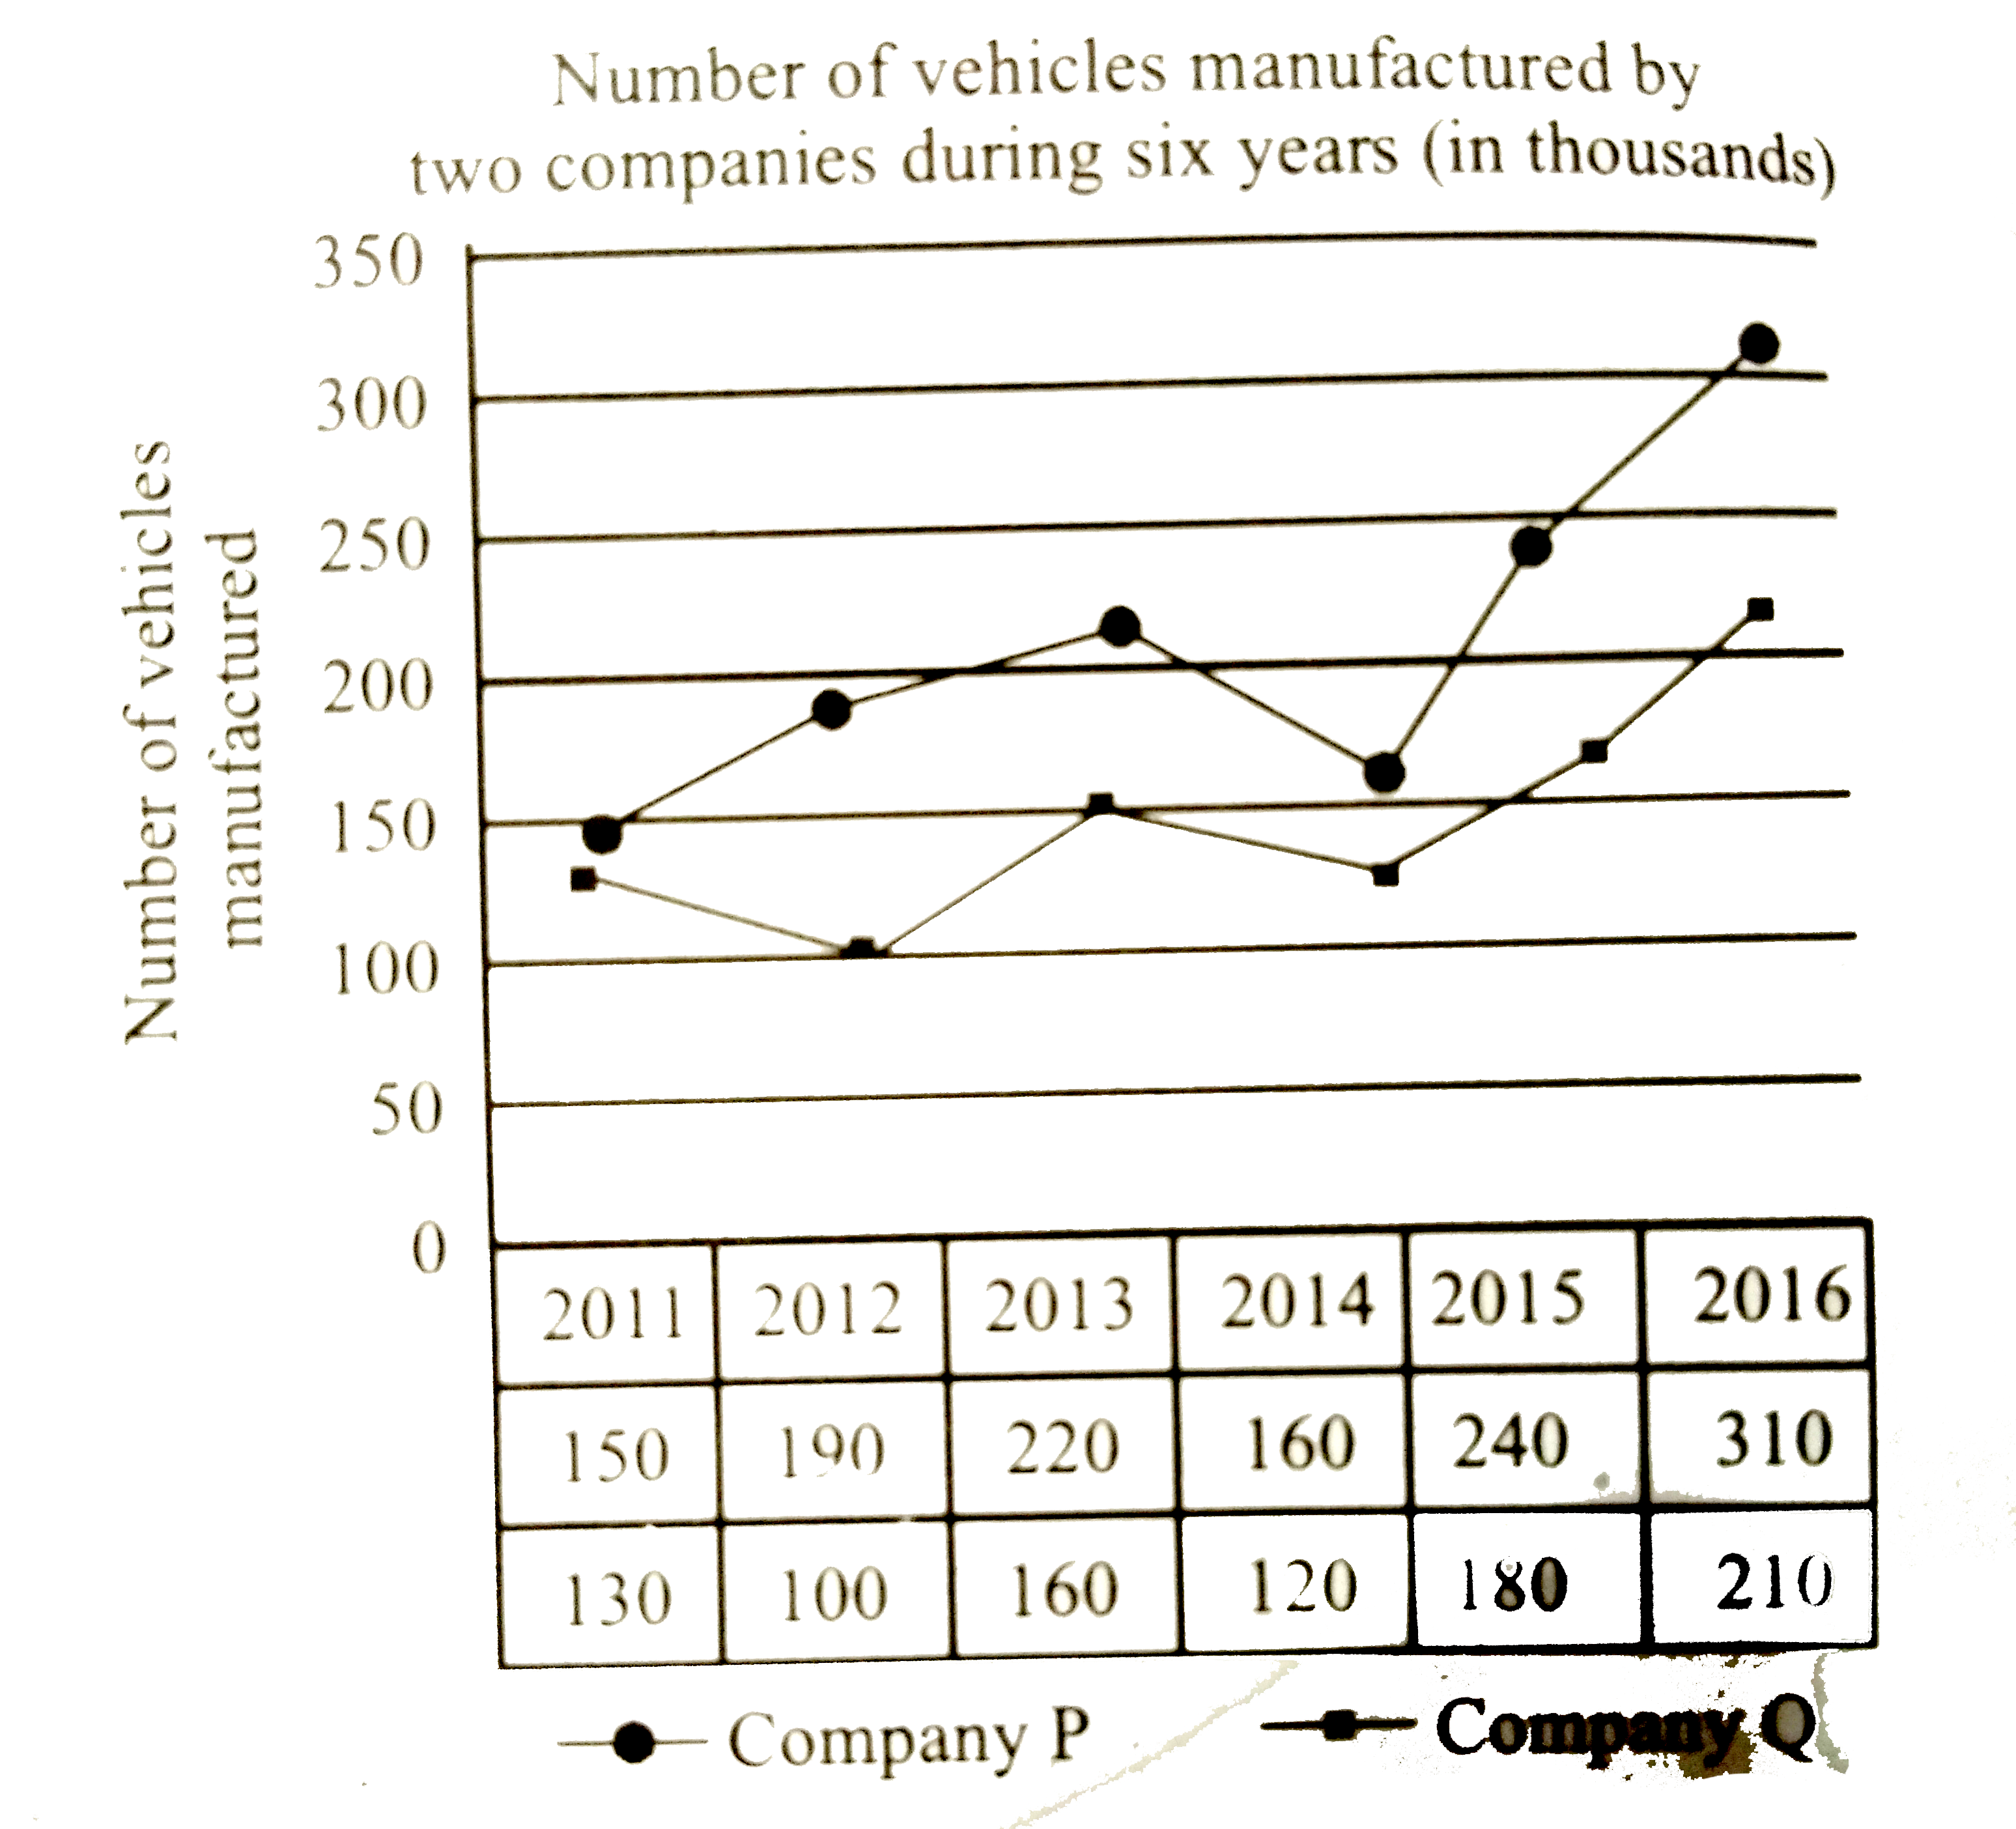
In year 2017, there was in increases of 30% in number of vehicles manufactured by company P as compared to vehicles manufactured by same company in the year 2012. What is the total number of vehicles manufactured by the same company in the year 2017 ?
View Solution
Knowledge Check
The table given below shows the information about bats manufactured by 6 different companies. Each company manufactures only plastic and wooden bats. Each company lables these bats as Brand A or Brand B. The table shows the number of plastic bats as percentage of total bats manufactured by each company. It also show the ratio of wooden bats labeled A and B. Each company manufactured a total of 550000 bats.
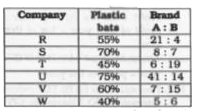
What is the total number of wooden bats of brand A manufactured by company T?A23420B22990C68920D72600Study the table carefully to answer the following questions ----
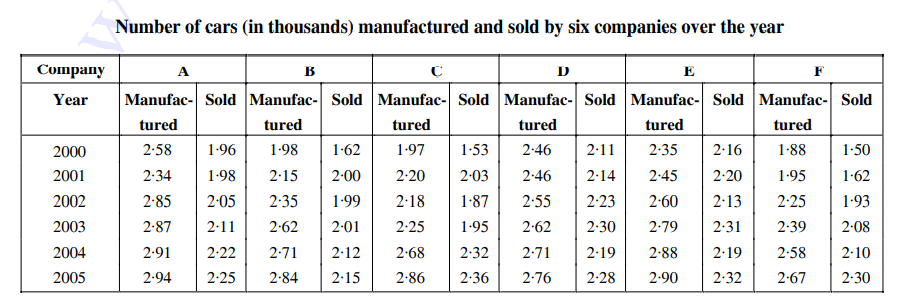
What is respective ratio of total number of cars manufactured by companies A, B and C together in the year 2001 to those manufactured by companies D, E and F together in the year 2003 ?A164 : 217B223 : 260C260 : 223D217 : 164The table given below shows the information about bats manufactured by 6 different companies. Each company manufactures only plastic and wooden bats. Each company lables these bats as Brand A or Brand B. The table shows the number of plastic bats as percentage of total bats manufactured by each company. It also show the ratio of wooden bats labeled A and B. Each company manufactured a total of 550000 bats.
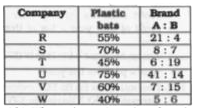
P = Sum of wooden bats of Brand B manufactured by S and wooden bats of Brand A manufactured by W. Q = Difference of Brand B wooden bats and Brand A wooden bats manufactured by U.
What is the value P - Q ?A197600B432890C260000D293300
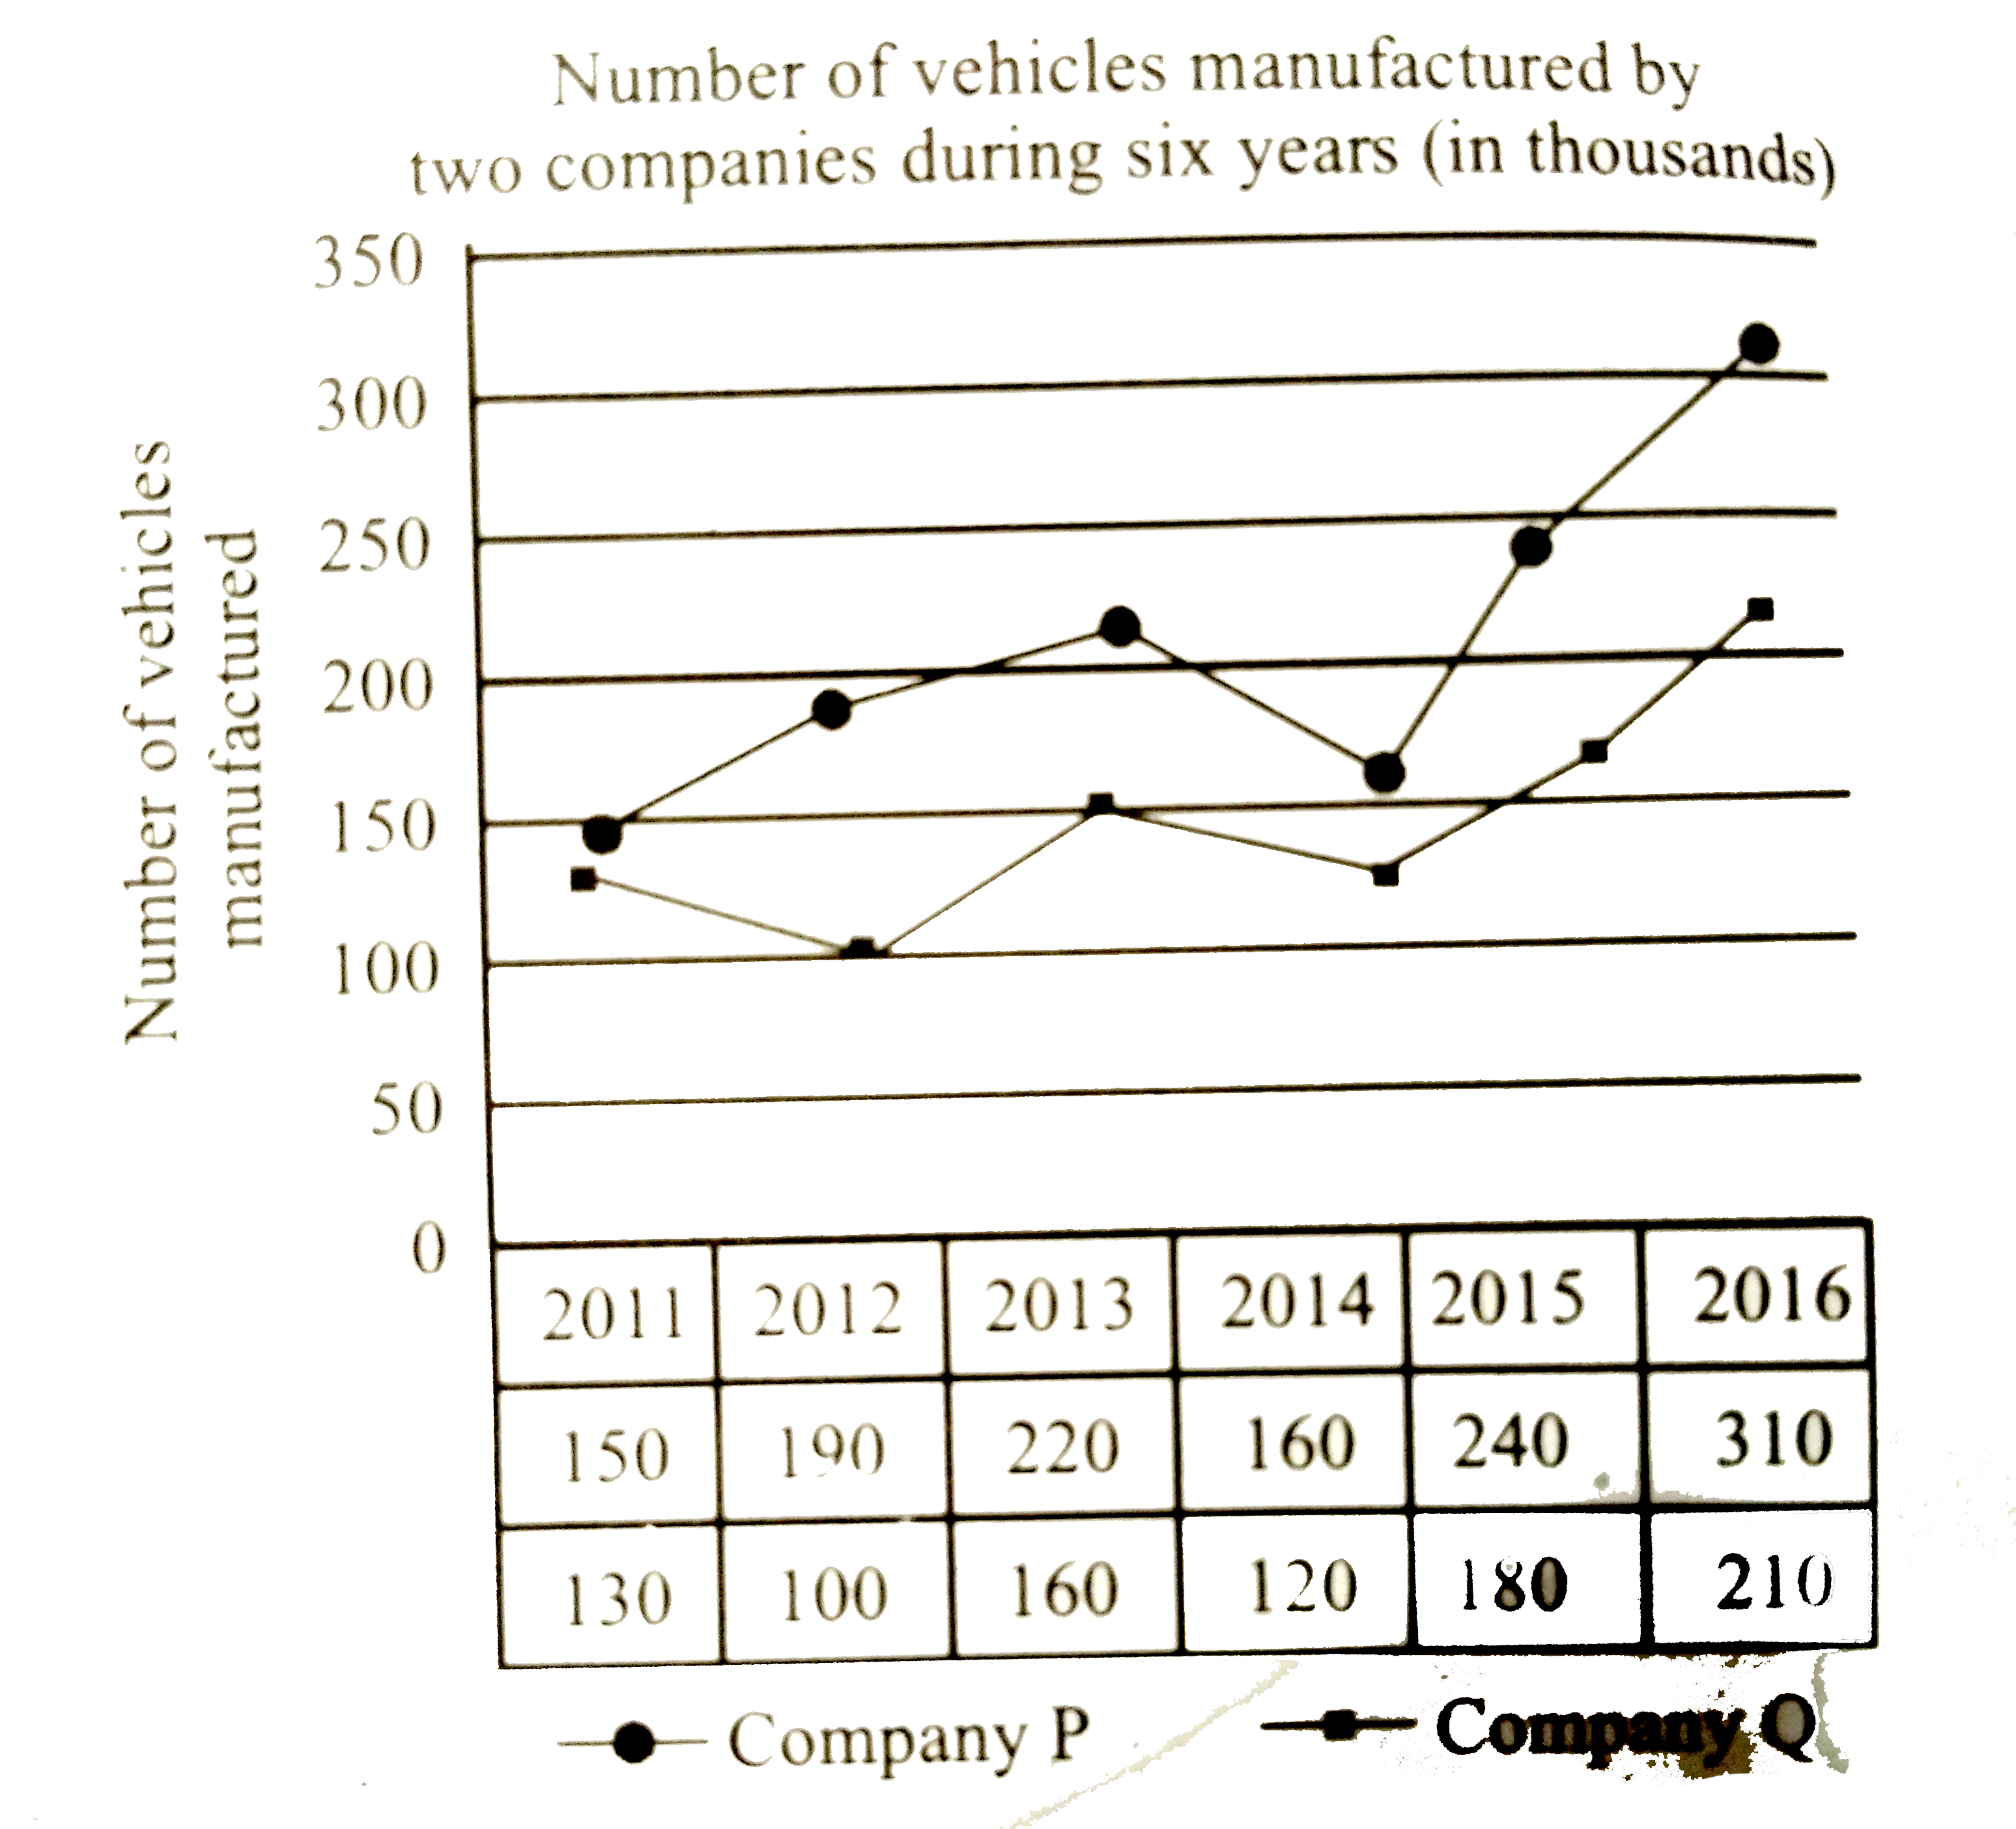
Out of the number of vehicles manufactured by company P in 2015,1500 pieces were found defective and out of the number of vehicles manufactured by company Q in 2016, 10000 pieces were found defective. Wha is the respective ratio of non-defectiv vehicles manufactured by comapny P in 2015 and Q in the 2016 ?
View SolutionStudy the following table, (which shows the number of units of an item manufactured and sold by 5 companies) and answer the question.
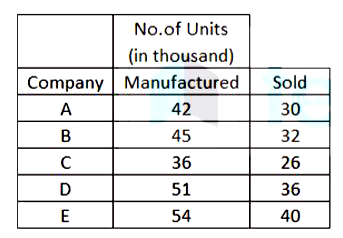
What percent of total number of units sold by companies A, B and D is equal to the number of units manufactured by company C? (correct to one decimal place)
View SolutionThe given pie chart shows information about the mobile phone manufacturing companies in India. The total number of mobile phone units manufactured is 12,40,000. How many units of mobile phones wre manufactured by company 'PQR' ?
View SolutionThe Bar graph given below presents the number of males and females working in five different companies.
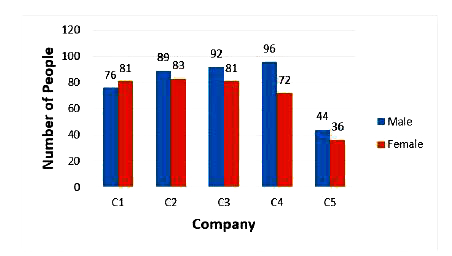
The total number of males working in these five companies is how much percent (approximately) more than the total number of females working in these five companies ?
View SolutionStudy the following table carefully to answer the questions that follows.
Number of Articles (in thousands) Manufactured (M) and Defective (D) company over the years-
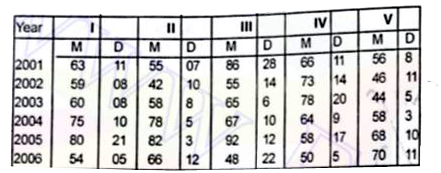
What was the percentage of defective articles over the number of articles manufactured by all units together in the year 2005 ?
View Solution
