Study the line graph carefully and answer the following questions.
The line graph shows the runs scored by two different teams in a series of 5 cricket matches.
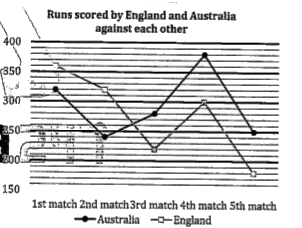
What is the ratio between total runs scored by Australia to that of England in all matches?
25:23
46:47
43:46
49:46
The correct Answer is:D
Step by step video, text & image solution for Study the line graph carefully and answer the following questions. The line graph shows the runs scored by two different teams in a series of 5 cricket matches. What is the ratio between total runs scored by Australia to that of England in all matches? by Maths experts to help you in doubts & scoring excellent marks in Class 14 exams.
Topper's Solved these Questions
- BOOK - ADDA247CHAPTER - DATA INTERPRETATIONEXERCISE - Prelims Questions (Level-1)54videos
DATA INTERPRETATION
- BOOK - ADDA247CHAPTER - DATA INTERPRETATIONEXERCISE - Prelims Questions (Level-2)59videos
DATA INTERPRETATION
- BOOK - ADDA247CHAPTER - DATA INTERPRETATIONEXERCISE - Previous Year Questions56videos
DATA INTERPRETATION
- BOOK - ADDA247CHAPTER - BOAT AND STREAM EXERCISE - Previous Year Question22videos
BOAT AND STREAM
- BOOK - ADDA247CHAPTER - DATA SUFFICIENCY EXERCISE - PREVIOUS YEAR QUESTIONS25videos
DATA SUFFICIENCY
Similar Questions
The table given below shows the runs scored by 5 players in four matches .
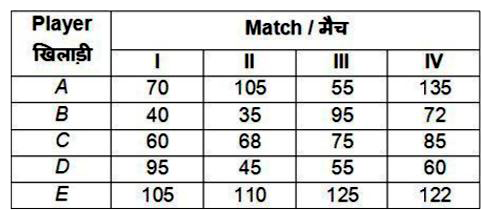
What is the difference between total runs scored by A and B in four matches?View SolutionStudy the given graph carefully and answer the following questions.
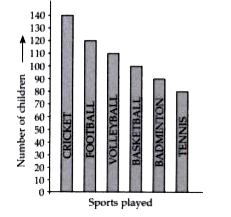
The difference between the number of children who pay tennis and cricket together & basketball and volleyball together isView Solution
Knowledge Check
- Question 1 - Select One
Study the following graph carefully and answer the following questions -----
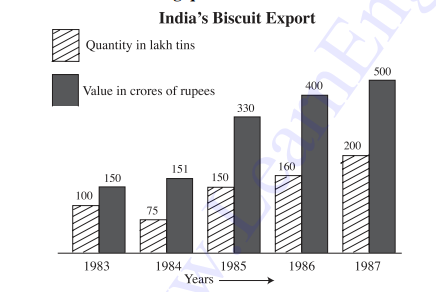
What was the difference between the tins exported in 1985 and 1986 ?A10B1000C100000D1000000 - Question 2 - Select One
Study the following graph carefully and answer the questions that follow
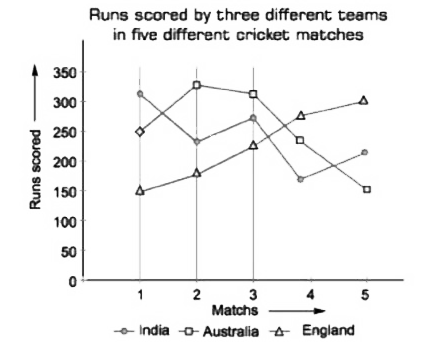
What are the average runs scored by all the three teams in Match 3 together ?Aa) 280Bb) 270Cc) 275Dd) 285 - Question 3 - Select One
Study the following graph carefully and answer the question given below-----
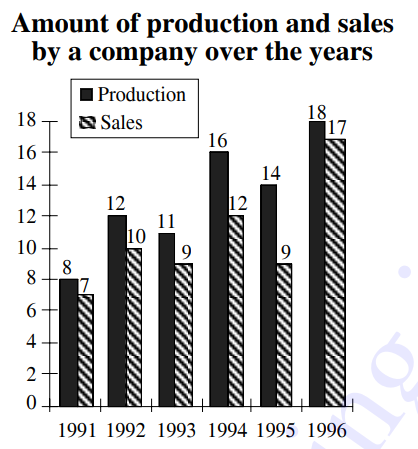
What was the difference between the sales of 1992 and 1995 ?A10 lakh tonnesB50 thousand tonnesC1 lakh tonnesD75 thousand tonnes
Direction: Read the Graph carefully and answer the following quesitons: The following Line graph shows the number of Fruits (Apple and Banana) sold in five different years.
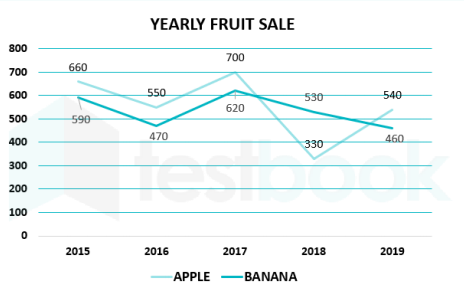
What is the ratio between the sales of apple in 2016 to banana in 2018?View SolutionThe line graph shows the scores of a batsman in 6 consecutive matches. What is his batting average in the 6 matches ?
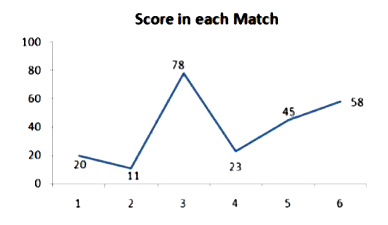 View Solution
Study the following graph carefully and answer the questions that follow
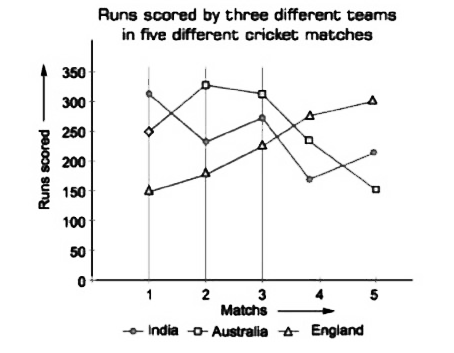
Total runs scored by India and Ausralia in Match 4 together is approximately , what percentage of the total runs scored by England in all thefive matches together ?View SolutionStudy the following graph carefully and answer the questions that follow
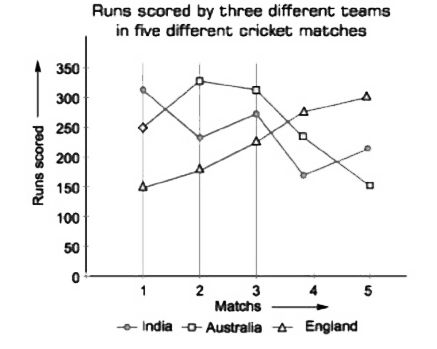
In which match the total runs scored by India and England together is the third highest /lowest ?View SolutionStudy the following graph carefully and answer the questions that follow
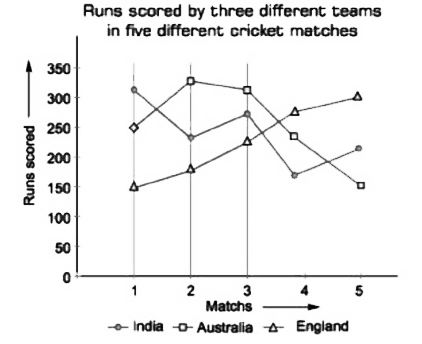
What is the respective ratio between the runs scored by India in Match 5 Australia in Match 1 and England in Match 2 ?View Solution

