Line graph given below shows percentage of defective article out of total manufactured/1 article in five different company i.e. (A, B, C, D and E).
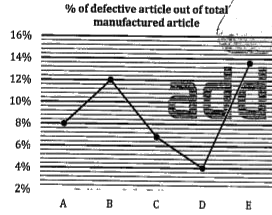
If ratio of defective article of company C to that of D is 2:3. Find ratio between total no. of article manufactured by company C to that of company D?
20:7
3:7
20:51
25:21
The correct Answer is:C
Step by step video, text & image solution for Line graph given below shows percentage of defective article out of total manufactured/1 article in five different company i.e. (A, B, C, D and E). If ratio of defective article of company C to that of D is 2:3. Find ratio between total no. of article manufactured by company C to that of company D? by Maths experts to help you in doubts & scoring excellent marks in Class 14 exams.
Topper's Solved these Questions
- BOOK - ADDA247CHAPTER - DATA INTERPRETATIONEXERCISE - Prelims Questions (Level-1)54videos
DATA INTERPRETATION
- BOOK - ADDA247CHAPTER - DATA INTERPRETATIONEXERCISE - Prelims Questions (Level-2)59videos
DATA INTERPRETATION
- BOOK - ADDA247CHAPTER - DATA INTERPRETATIONEXERCISE - Previous Year Questions56videos
DATA INTERPRETATION
- BOOK - ADDA247CHAPTER - BOAT AND STREAM EXERCISE - Previous Year Question22videos
BOAT AND STREAM
- BOOK - ADDA247CHAPTER - DATA SUFFICIENCY EXERCISE - PREVIOUS YEAR QUESTIONS25videos
DATA SUFFICIENCY
Similar Questions
The table given below shows the information about bats manufactured by 6 different companies. Each company labels these bats as Brand A or Brand B. The table shows the number of plastic bats as a percentage of total bats manufactured by each company. It also shows the ratio of wooden bats labeled A and B. Each company manufactured a total of 550,000 bats.
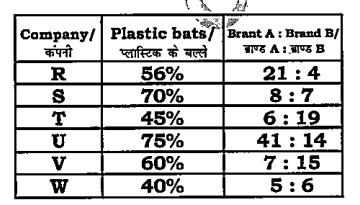 What is the total number of wooden bats of brand A manufactured by company T ? View Solution
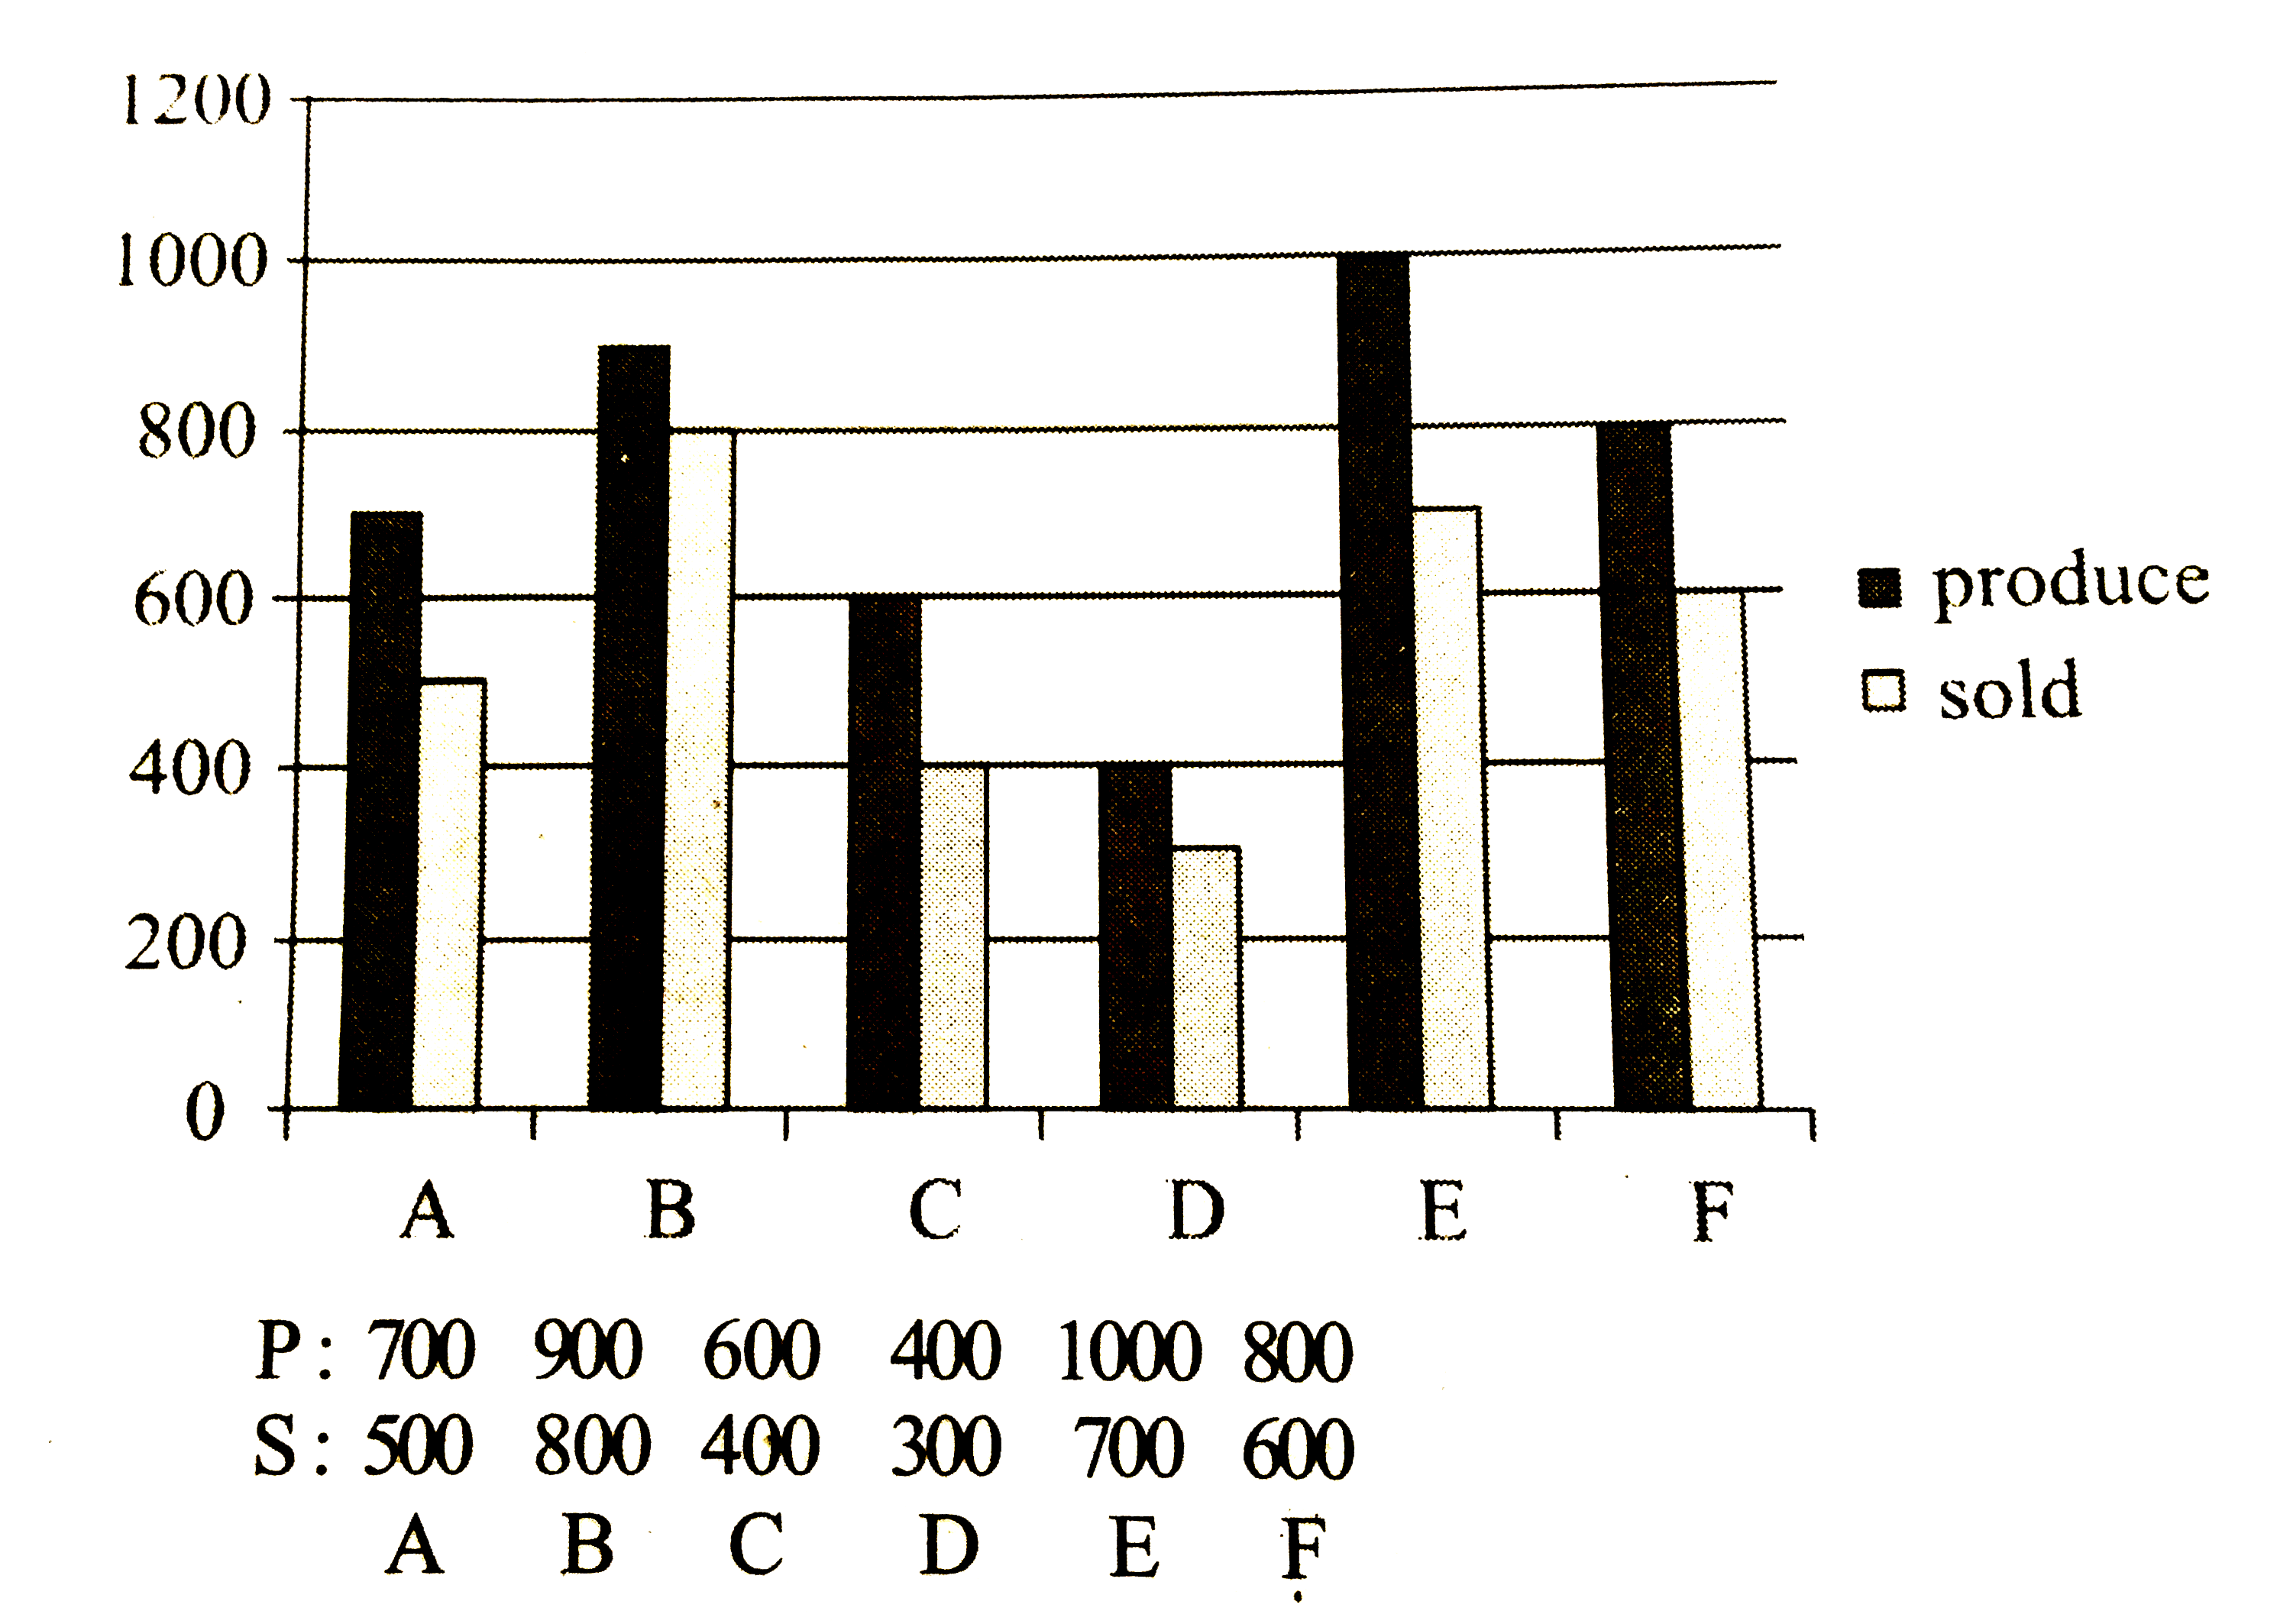
What is the ratio of the total production of the company B and C together to the total sales of the same companies ?View Solution
Knowledge Check
- Question 1 - Select One
The Bar graph given below presents the number of males and females working in five different companies.
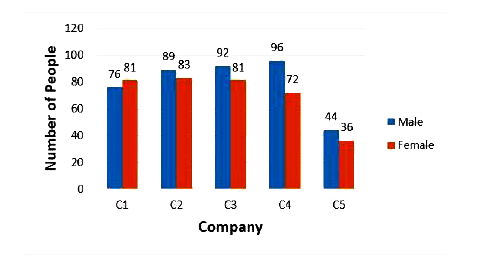
What is the ratio of the total number of males working in the Companies C2 and C3 to the total number of females working in C1 and C5 ?A171:136B181:117C182:119D183:124 - Question 2 - Select One
The Pie Chart given below presents the number of laptops as a percentage of the total number of laptops in an office delivered by six different companies.
The central angles shown in the Pie Chart are not as any chosen scale.
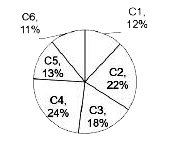
What is the ratio of the number of laptops of Company C1 to that of Company C3 ?A2:3B12:11C2:1D6:11 - Question 3 - Select One
The table given below shows the information about bats manufactured by 6 different companies. Each company manufactures only plastic and wooden bats. Each company lables these bats as Brand A or Brand B. The table shows the number of plastic bats as percentage of total bats manufactured by each company. It also show the ratio of wooden bats labeled A and B. Each company manufactured a total of 550000 bats.
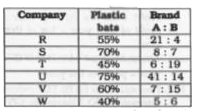
What is the total number of wooden bats of brand A manufactured by company T?A23420B22990C68920D72600
The table given below shows the information about bats manufactured by 6 different companies. Each company manufactures only plastic and wooden bats. Each company lables these bats as Brand A or Brand B. The table shows the number of plastic bats as percentage of total bats manufactured by each company. It also show the ratio of wooden bats labeled A and B. Each company manufactured a total of 550000 bats.

What is the total number of wooden bats of brand A manufactured by company T?View SolutionThe table given below shows the information about bats manufactured by 6 different companies. Each company manufactures only plastic and wooden bats. Each company lables these bats as Brand A or Brand B. The table shows the number of plastic bats as percentage of total bats manufactured by each company. It also show the ratio of wooden bats labeled A and B. Each company manufactured a total of 550000 bats.
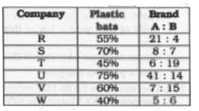
Taking all 6 companies together, how many wooden bats f Brand A have been produced?View SolutionThe given data shows the number of mobiles (in thousands) manufactured by companies C-1, C-2, C-3 and C-4 in 2017. 2018 and 2019.
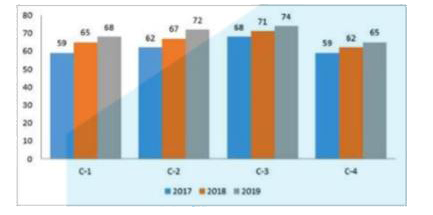
What is the ratio of total products manufactured by C-1 to that of C-4?View SolutionThe table given below shows the information about bats manufactured by 6 different companies. Each company manufactures only plastic and wooden bats. Each company lables these bats as Brand A or Brand B. The table shows the number of plastic bats as percentage of total bats manufactured by each company. It also show the ratio of wooden bats labeled A and B. Each company manufactured a total of 550000 bats.
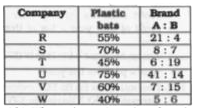
P = Sum of wooden bats of Brand B manufactured by S and wooden bats of Brand A manufactured by W. Q = Difference of Brand B wooden bats and Brand A wooden bats manufactured by U.
What is the value P - Q ?View SolutionFind the ratio of total sales in the two years of Company C2 and the ratio of total sales in both years of Company C4?
View Solution

