Bar graph given below shows number of mobile phones (in thousand) sold in 2017 and percentage increase in sales of these mobile phones in 2018 as compared to previous year of 5 different companies. Read the data carefully and answer the following question.
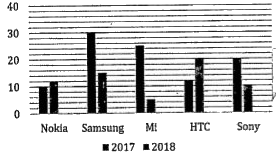
What is average no. of MI and HTC mobiles sold in year 2018?
20325
17325
18050
19050
The correct Answer is:A
Step by step video, text & image solution for Bar graph given below shows number of mobile phones (in thousand) sold in 2017 and percentage increase in sales of these mobile phones in 2018 as compared to previous year of 5 different companies. Read the data carefully and answer the following question. What is average no. of MI and HTC mobiles sold in year 2018? by Maths experts to help you in doubts & scoring excellent marks in Class 14 exams.
Topper's Solved these Questions
- BOOK - ADDA247CHAPTER - DATA INTERPRETATIONEXERCISE - Prelims Questions (Level-1)54videos
DATA INTERPRETATION
- BOOK - ADDA247CHAPTER - DATA INTERPRETATIONEXERCISE - Prelims Questions (Level-2)59videos
DATA INTERPRETATION
- BOOK - ADDA247CHAPTER - DATA INTERPRETATIONEXERCISE - Previous Year Questions56videos
DATA INTERPRETATION
- BOOK - ADDA247CHAPTER - BOAT AND STREAM EXERCISE - Previous Year Question22videos
BOAT AND STREAM
- BOOK - ADDA247CHAPTER - DATA SUFFICIENCY EXERCISE - PREVIOUS YEAR QUESTIONS25videos
DATA SUFFICIENCY
Similar Questions
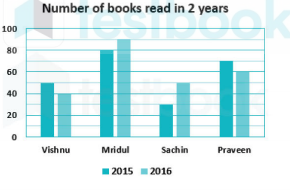
Directions: Read the bar graph carefully and answer the given questions.What is the average of total number of books read by all of them in the year 2016?View SolutionRead the following graph carefully and answer the questions given below:
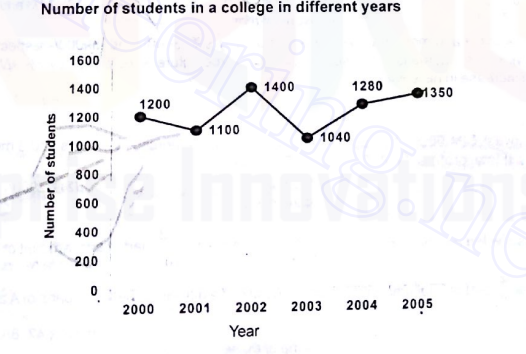
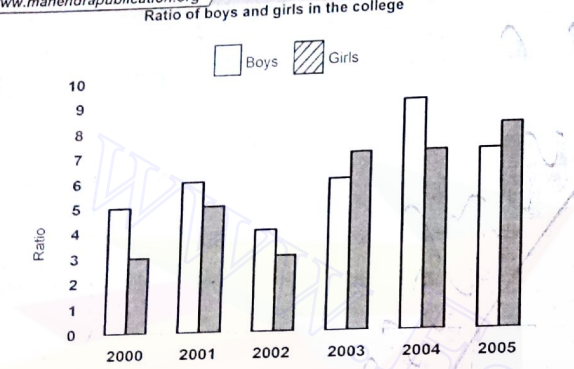
What is the average number of girls in all the years?View Solution
Knowledge Check
- Question 1 - Select One
Study the table carefully to answer the questions that follow-
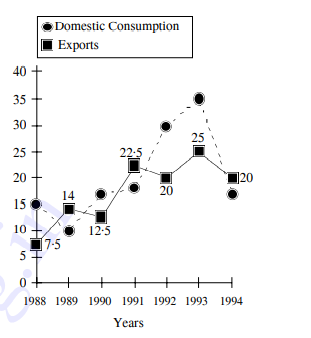
What is the approximate average number of units sold in the year 1999?A407300000B4040000C42740000D4073000000 - Question 2 - Select One
The bar chart given below shows the revenue (in crores) of company A for the years 2008 to 2015.
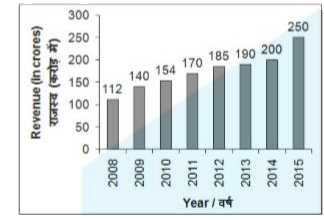
What is the percentage increase in revenue in the year 2010 in comparison to the previous year?Aa)10Bb)12Cc)20Dd)25 - Question 3 - Select One
The bar chart given below shows the sales (in '000 units) of 4 mobile brands for 3 years.
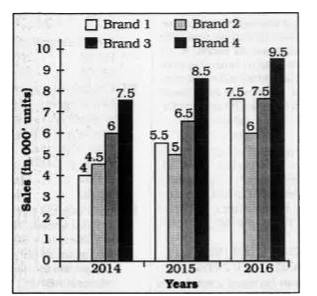
What is the percentage increase in the number of mobile phones of Brand 2 sold from 2014 to 2015?A8.33B33.33C37.5D11.11
Following bar graph shown the income and expenditure ( in Rs. lakhs) of a ceremony. Read the graph carefully and answer the questions.
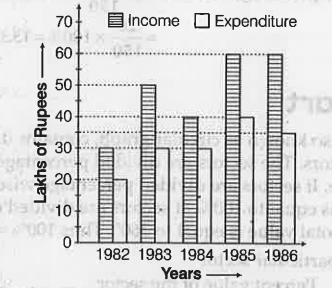
What is the average income of the company are the years?View SolutionRead the following graph carefully and answer the questions given below:


What is the difference between the number of boys and girls in the year 2004 ?View SolutionThe bar chart given below shows the percentage distribution of the production of various models of a ,mobile manufacturing company in 2007 and 2008. The total production in 2007 was 35 lakh mobile phones and in 2008 the production was 44 lakh. Study the chart and answer the following questions.
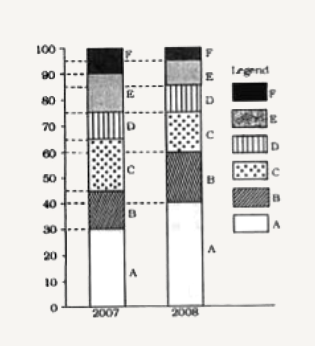
What was the difference in the number of B type mobiles produced in 2007 and 2008 ?View SolutionRead the bar graph given below and answer the following questions:
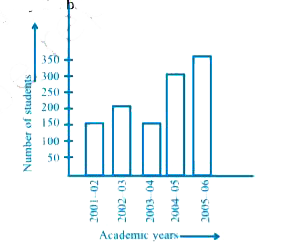
In which year is the increase in number of students maximum as compared to the previous year?View SolutionThe bar chart given below shows the sales (in '000 units) of 4 mobile brands for 3 years.
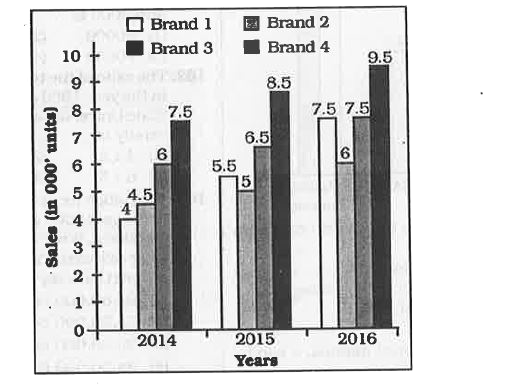
What is the percentage increase in the number of mobile phones of Brand 2 sold from 2014 to 2015?View Solution

