Study the line graph carefully and answer the following questions.
The line graph shows the runs scored by two different teams in a series of 5 cricket matches.
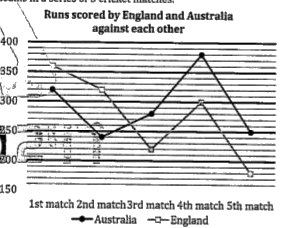
Find the difference between maximum runs scored by England and minimum runs scored by Australia.
120 runs
80 runs
150 runs
200 runs
The correct Answer is:A
Step by step video & image solution for Study the line graph carefully and answer the following questions. The line graph shows the runs scored by two different teams in a series of 5 cricket matches. Find the difference between maximum runs scored by England and minimum runs scored by Australia. by Maths experts to help you in doubts & scoring excellent marks in Class 14 exams.
Topper's Solved these Questions
- BOOK - ADDA247CHAPTER - DATA INTERPRETATIONEXERCISE - Prelims Questions (Level-1)54videos
DATA INTERPRETATION
- BOOK - ADDA247CHAPTER - DATA INTERPRETATIONEXERCISE - Prelims Questions (Level-2)59videos
DATA INTERPRETATION
- BOOK - ADDA247CHAPTER - DATA INTERPRETATIONEXERCISE - Previous Year Questions56videos
DATA INTERPRETATION
- BOOK - ADDA247CHAPTER - BOAT AND STREAM EXERCISE - Previous Year Question22videos
BOAT AND STREAM
- BOOK - ADDA247CHAPTER - DATA SUFFICIENCY EXERCISE - PREVIOUS YEAR QUESTIONS25videos
DATA SUFFICIENCY
Similar Questions
Knowledge Check
- Question 1 - Select One
Study the following graph carefully and answer the questions that follow
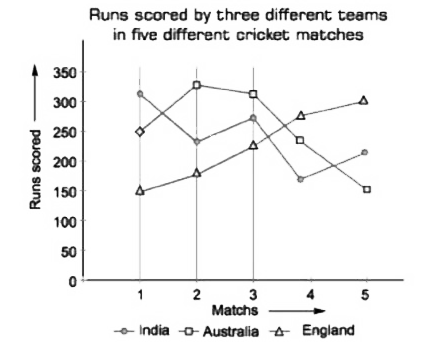
What are the average runs scored by all the three teams in Match 3 together ?Aa) 280Bb) 270Cc) 275Dd) 285 - Question 2 - Select One
Study the following graph carefully and answer the questions that follow
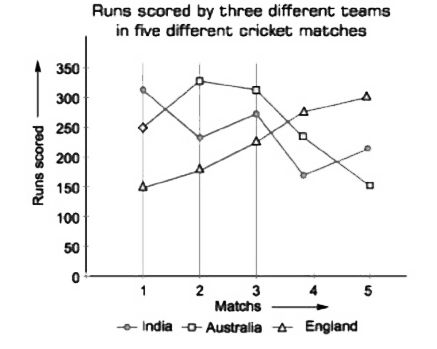
In which match the total runs scored by India and England together is the third highest /lowest ?A1B2C3D4 - Question 3 - Select One
Study the following graph carefully and answer the questions that follow
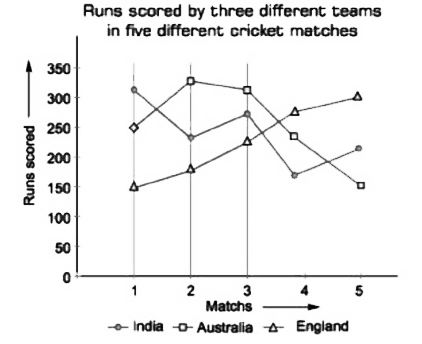
What is the respective ratio between the runs scored by India in Match 5 Australia in Match 1 and England in Match 2 ?A11:13:7B11:7:13C11:3:9D11:13:9
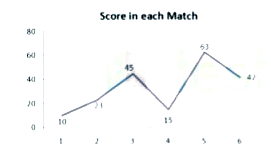
The line graph shows the scores of a batsman in 6 consecutive matches. What is his batting average in the 6 matches?
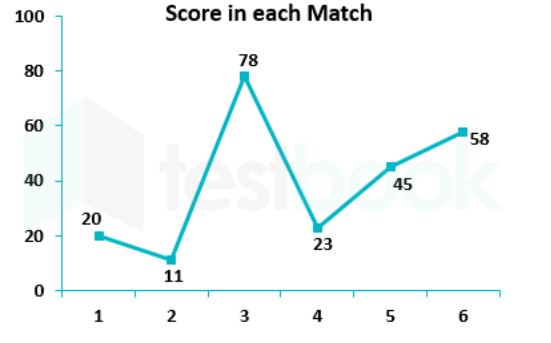 View Solution
Which of the following is the most appropriate to demonstrate the runs scored in the various ovens of a cricket match ?
View SolutionStudy the following graph carefully and answer the questions that follow
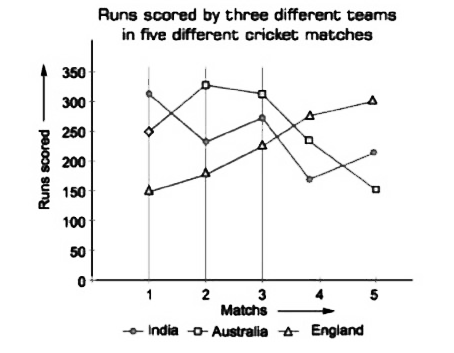
Total runs scored by India and Ausralia in Match 4 together is approximately , what percentage of the total runs scored by England in all thefive matches together ?View SolutionStudy the following graph carefully and answer the questions that follow
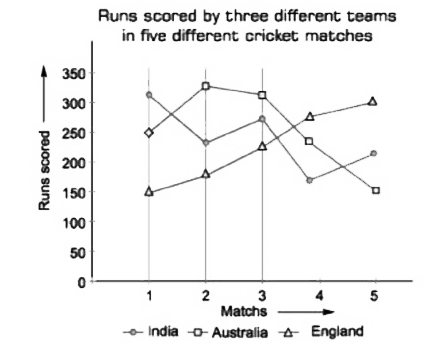
In which match , is the difference between the runs scored by Australia and England second lowest ?View SolutionThe table given below shows the runs scored by 4 different batsmen B1, B2, B3 and B4 in 5 different matches of a series.
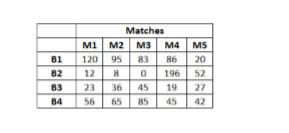
What is the difference in the total numberof runs scored by B1 and B4 in these 5 matches?View Solution


