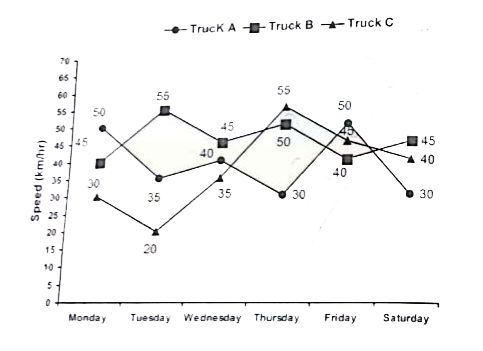
Line graph given below shows distance (in km) covered by Truck A and Truck B on five different days. Study the data carefully and answer the following questions.
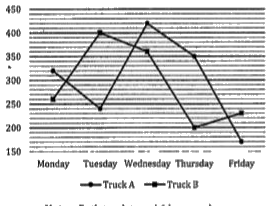
Average speed of truck A on Friday is what percent of the average speed of truck B on Monday?
65511%
45713%
55513%
65513%
The correct Answer is:D
Step by step video, text & image solution for Line graph given below shows distance (in km) covered by Truck A and Truck B on five different days. Study the data carefully and answer the following questions. Average speed of truck A on Friday is what percent of the average speed of truck B on Monday? by Maths experts to help you in doubts & scoring excellent marks in Class 14 exams.
Topper's Solved these Questions
- BOOK - ADDA247CHAPTER - DATA INTERPRETATIONEXERCISE - Prelims Questions (Level-2)59videos
DATA INTERPRETATION
- BOOK - ADDA247CHAPTER - DATA INTERPRETATIONEXERCISE - Mains Questions33videos
DATA INTERPRETATION
- BOOK - ADDA247CHAPTER - DATA INTERPRETATIONEXERCISE - Basic Questions30videos
DATA INTERPRETATION
- BOOK - ADDA247CHAPTER - BOAT AND STREAM EXERCISE - Previous Year Question22videos
BOAT AND STREAM
- BOOK - ADDA247CHAPTER - DATA SUFFICIENCY EXERCISE - PREVIOUS YEAR QUESTIONS25videos
DATA SUFFICIENCY
Similar Questions
Bar graph given below shows pens sold by a retailor on five different days. Study the data carefully and answer the following questions.
Pen sold on different days
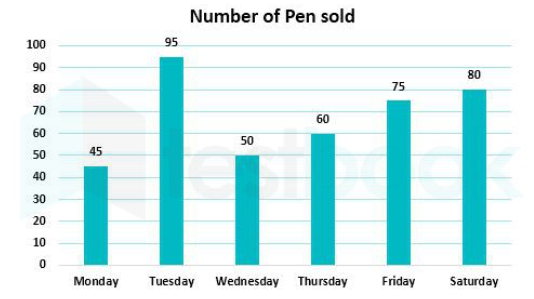
what is the average number of pens sold during a week if total number of pens sold on saturday is 25% more than total number of pens sold on Sunday .View SolutionBar graph given below shows pens sold by a retailor on five different days. Study the data carefully and answer the following questions.
Pen sold on different days
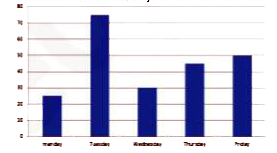
Find the difference between total number of pens sold on Monday and Tuesday together to total number of pens sold on Thursday and Friday together?View Solution
Knowledge Check
- Question 1 - Select One
Study the graph carefully and answer the questions below it -----
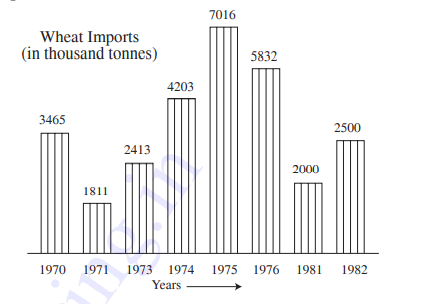
The imports in 1974 is approximately what percent of the average imports for the given years ?A125B115C190D85 - Question 2 - Select One
Study the following graph carefully and answer the questions that
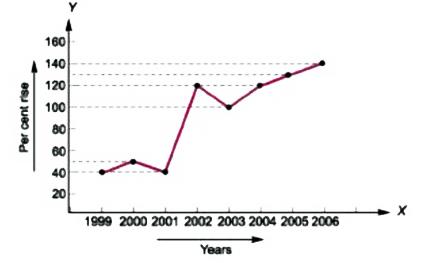
What was the average of percent rise over the given years ?A1.1B1.05C100.5%D92.5% - Question 3 - Select One
Study the following graph carefully and answer the questions -----
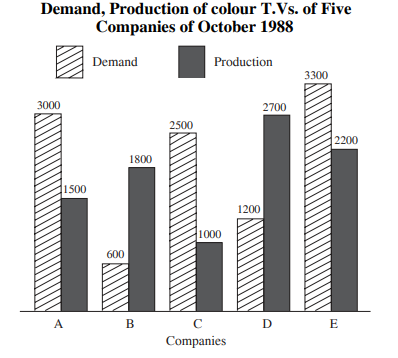
The demand for company 'B' is approximately what percent of the demand for company 'C' ?A4B24C20D60
Study the following graph carefully and answer the questions given below it -----
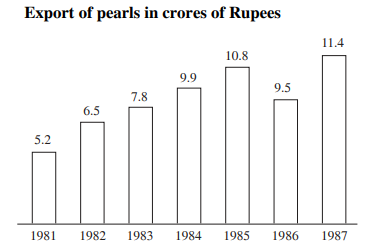
In how many years was the export above the average for the given period ?View SolutionThe table below represents the distance (in km) travelled by six trucks on six different days of the week. Read the table and answer the questions based on it.
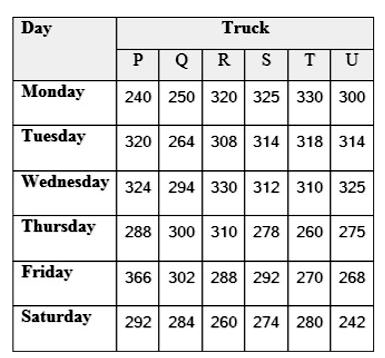
If to travel the given distance, the time taken by Truck Q on Friday was 8 hours, then what was its average speed on that day ?
A. 37.5 km/hr
B. 42.50 km/hr
C. 28.25 km/hr
D. 32.25 km/hrView SolutionWhat is the average speed of truck A iin metre / second for all the days together ?
 View Solution
Study the following graph carefully and answer the questions that
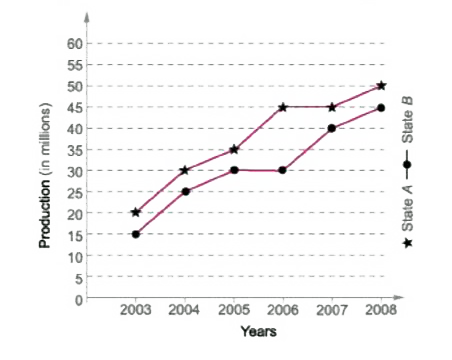
What was the average population of State B ( in millions ) for the years together ?View SolutionStudy the following graph carefully to answer these questions-
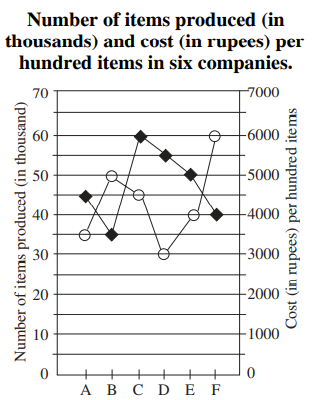
What is the average cost per hundred items for all the given companies?View Solution

