Pie chart given below gives information about distribution of voters in six different city out of total voters.
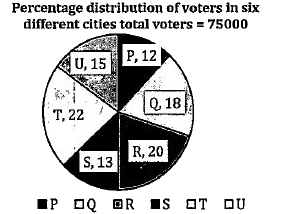
Average no. of voters in city P, Q, and U are equal to total no. of voters of which city?
P
Q
S
U
The correct Answer is:D
Step by step video, text & image solution for Pie chart given below gives information about distribution of voters in six different city out of total voters. Average no. of voters in city P, Q, and U are equal to total no. of voters of which city? by Maths experts to help you in doubts & scoring excellent marks in Class 14 exams.
Topper's Solved these Questions
- BOOK - ADDA247CHAPTER - DATA INTERPRETATIONEXERCISE - Prelims Questions (Level-2)59videos
DATA INTERPRETATION
- BOOK - ADDA247CHAPTER - DATA INTERPRETATIONEXERCISE - Mains Questions33videos
DATA INTERPRETATION
- BOOK - ADDA247CHAPTER - DATA INTERPRETATIONEXERCISE - Basic Questions30videos
DATA INTERPRETATION
- BOOK - ADDA247CHAPTER - BOAT AND STREAM EXERCISE - Previous Year Question22videos
BOAT AND STREAM
- BOOK - ADDA247CHAPTER - DATA SUFFICIENCY EXERCISE - PREVIOUS YEAR QUESTIONS25videos
DATA SUFFICIENCY
Similar Questions
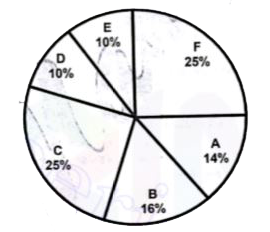
The pie chart given below sows the number of students in 6 different sections. The total number of students is 1800.
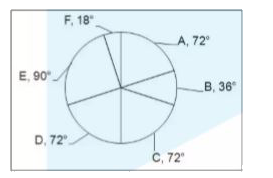
What is the average number of students in section A, B and F?View Solution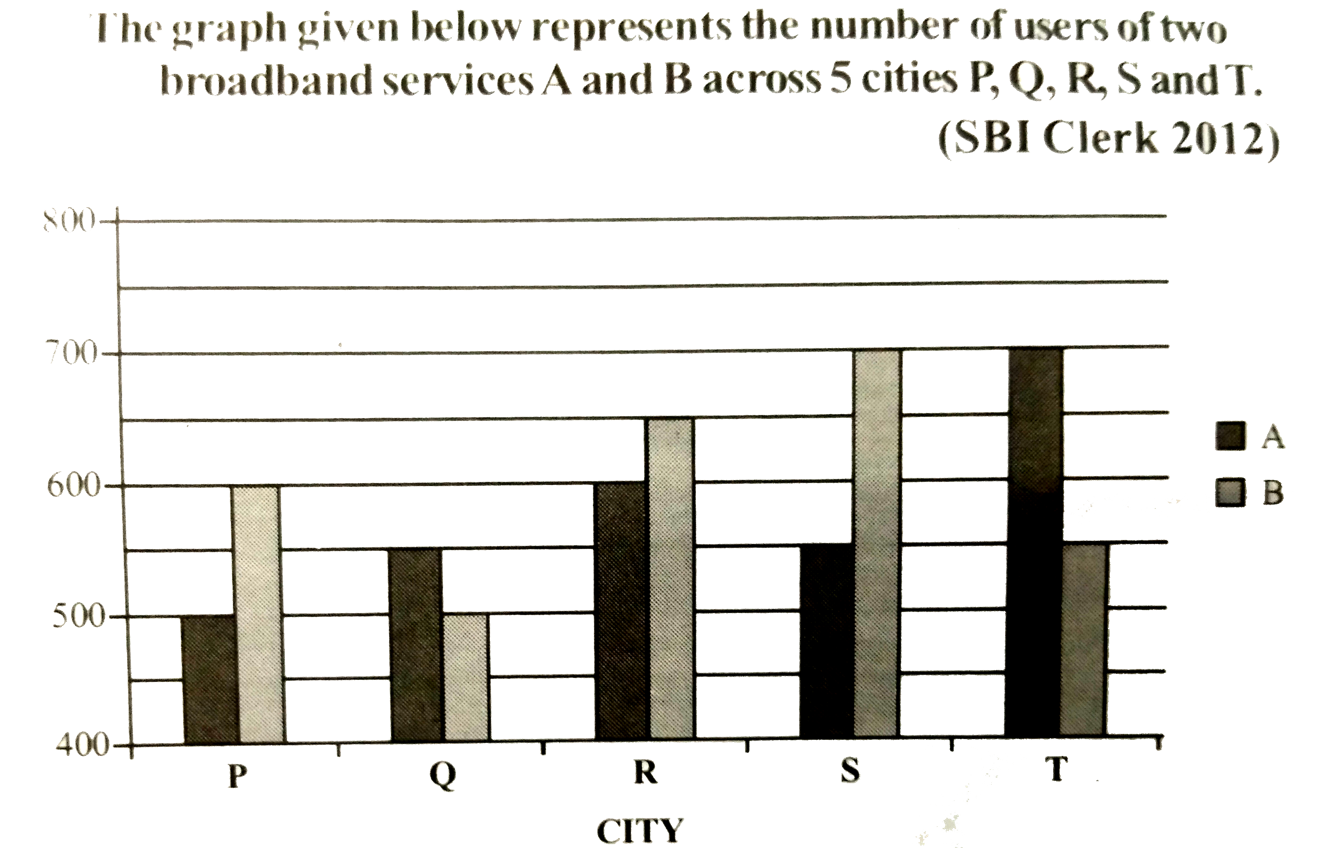
What is the difference between the total number of users of Brand A and B together in city R and the total number of users of brand A annd B together in city P ?View Solution
Knowledge Check
- Question 1 - Select One
Read the following pie-chart carefully and answer the questions given below :
Distribution of total voters from six different cities and the distribution of female voters among these cities.
Total number of voters=64000
Ratio of males and females = 5 : 3
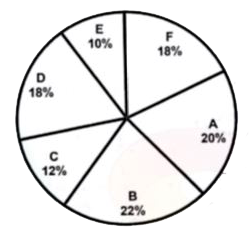
Percentage distribution of female voters
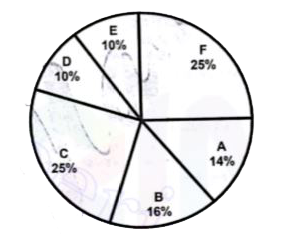
The number of male voters in city F is approximately what percent of the total number of voters in the same city ? (approx.)AA) 48BB) 44CC) 53DD) 57 - Question 2 - Select One
Read the following pie-chart carefully and answer the questions given below :
Distribution of total voters from six different cities and the distribution of female voters among these cities.
Total number of voters=64000
Ratio of males and females = 5 : 3
Percentage distribution of male voters
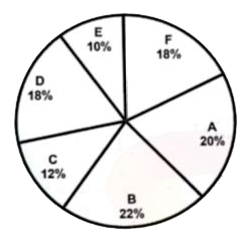
Percentage distribution of female voters
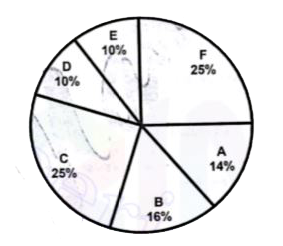
What is the average number of female voters in city A, B and E together ?AA) 4200BB) 2300CC) 3200DD) 2400 - Question 3 - Select One
Read the following pie-chart carefully and answer the questions given below :
Distribution of total voters from six different cities and the distribution of female voters among these cities.
Total number of voters=64000
Ratio of males and females = 5 : 3
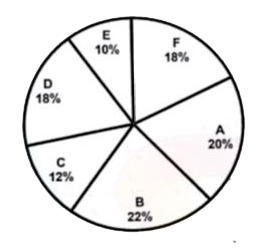
Percentage distribution of female voters
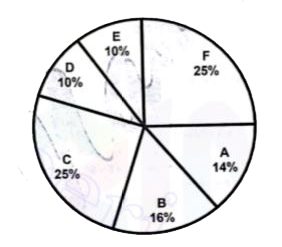
The number of male voters in city C is what percent of the number of male voters in city D ? (approx)AA) 67BB) 48CC) 30DD) 18
Read the following pie-chart carefully and answer the questions given below :
Distribution of total voters from six different cities and the distribution of female voters among these cities.
Total number of voters=64000
Ratio of males and females = 5 : 3
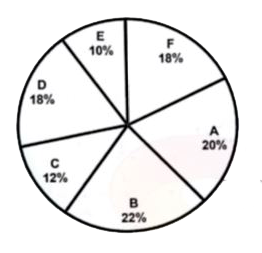
Percentage distribution of female voters
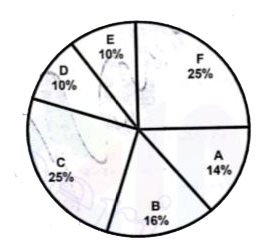
The number of female voters in city D is what percent of the male voteres in city A ? (approx)View SolutionRead the following pie-chart carefully and answer the questions given below :
Distribution of total voters from six different cities and the distribution of female voters among these cities.
Total number of voters=64000
Ratio of males and females = 5 : 3
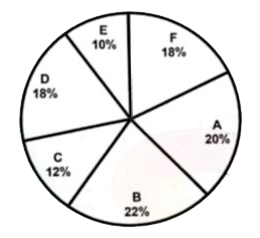
Percentage distribution of female voters
In which two cities the ratio between the female voters is 7 : 8 ?View SolutionThe pie chart given below shows sale of different types of cars in a city for a given year. The total sale of cars in the city is 600000.
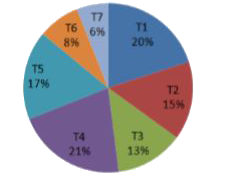
What is the sum of total number of cars sold of type T5, T6 and T3?View Solutionthe pie chart given below shows the distribution of students who like the given 5 sports. . The total number of students is 960.
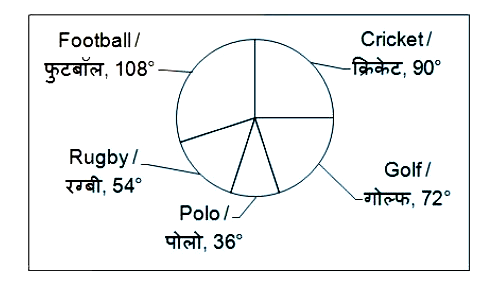
What is the average number of students who like Golf and Cricket?View SolutionThe pie-chart shows percentage wise distribution of teachers who teach six different subjects. Study the pie chart and answer the question :
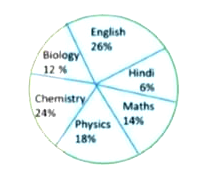
Total number of teachers =1650
What is the difference between the total number of teachers who teach Physics and Maths and the total number of teachers who tech chemistry and biology ?View Solution

