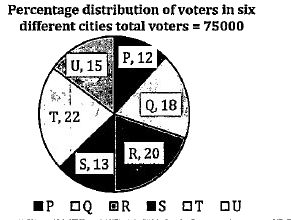
Pie chart given below gives information about distribution of voters in six different city out of total voters.
No. of book sold varies with no. of selection of candidate when 1200 book were sold, total 1050 candidate were selected. Find no. selection if 400 books were sold.
250
350
200
375
The correct Answer is:B
Topper's Solved these Questions
- DATA INTERPRETATIONBOOK - ADDA247CHAPTER - DATA INTERPRETATIONEXERCISE - Prelims Questions (Level-2)
59 Videos
- DATA INTERPRETATIONBOOK - ADDA247CHAPTER - DATA INTERPRETATIONEXERCISE - Mains Questions
33 Videos
- DATA INTERPRETATIONBOOK - ADDA247CHAPTER - DATA INTERPRETATIONEXERCISE - Basic Questions
30 Videos
- BOAT AND STREAM BOOK - ADDA247CHAPTER - BOAT AND STREAM EXERCISE - Previous Year Question
22 Videos
- DATA SUFFICIENCY BOOK - ADDA247CHAPTER - DATA SUFFICIENCY EXERCISE - PREVIOUS YEAR QUESTIONS
25 Videos
Similar Questions
Direction :- Given below is the pie chart which shows the percentage distribution of a book 'XYZ'.
Published in 5 different stores.
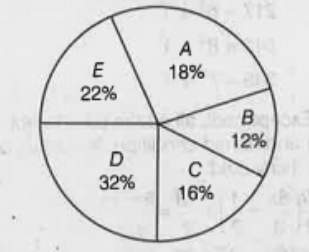
Total number of books = 550
Find the central angle for the book D.
View Solution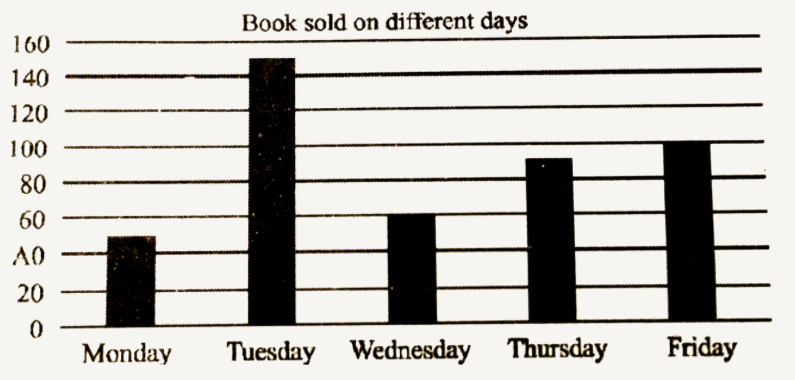
Find the difference between total number of books sold on Monday and Tuesday together to total number of books sold on Thursday and Friday together ?
View Solution
Knowledge Check
The Bar graph given below presents the number of books sold by a bookseller during different months of a year.
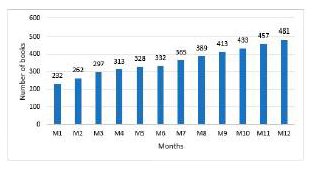
What is the total number of books sold by the bookseller in the year?A4032B4132C4302D4202Read the following pie-chart carefully and answer the questions given below :
Distribution of total voters from six different cities and the distribution of female voters among these cities.
Total number of voters=64000
Ratio of males and females = 5 : 3
Percentage distribution of male voters
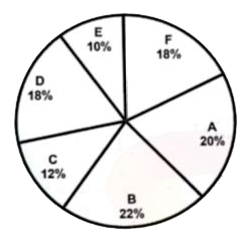
Percentage distribution of female voters
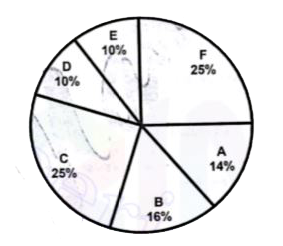
What is the average number of female voters in city A, B and E together ?AA) 4200BB) 2300CC) 3200DD) 2400Read the following pie-chart carefully and answer the questions given below :
Distribution of total voters from six different cities and the distribution of female voters among these cities.
Total number of voters=64000
Ratio of males and females = 5 : 3
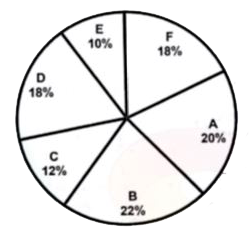
Percentage distribution of female voters
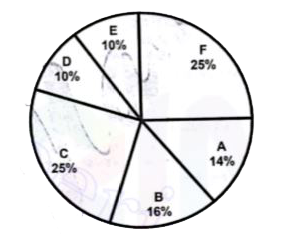
The number of male voters in city F is approximately what percent of the total number of voters in the same city ? (approx.)AA) 48BB) 44CC) 53DD) 57
The following questions are based on the information given below. Read the information given below and answer the question that follow: Information about the Number of Candidates who appeared, qualified and then were selected in a Competitive Examination from Delhi over the years 1997 to 2001 is given below:
 For which year is the ratio of number of candidates who were selected to the number of candidates who qualified the highest?
(A) 1998 (B) 2000 (C ) 2001 (D) 1999
View SolutionRead the following pie-chart carefully and answer the questions given below :
Distribution of total voters from six different cities and the distribution of female voters among these cities.
Total number of voters=64000
Ratio of males and females = 5 : 3
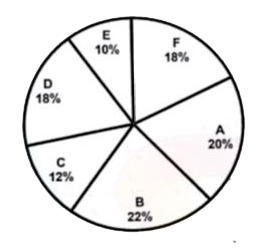
Percentage distribution of female voters
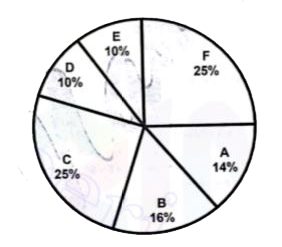
The number of male voters in city C is what percent of the number of male voters in city D ? (approx)
View SolutionRead the following pie-chart carefully and answer the questions given below :
Distribution of total voters from six different cities and the distribution of female voters among these cities.
Total number of voters=64000
Ratio of males and females = 5 : 3
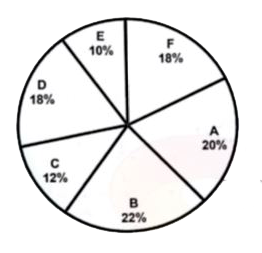
Percentage distribution of female voters
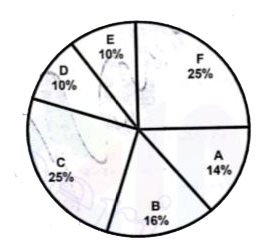
The number of female voters in city D is what percent of the male voteres in city A ? (approx)
View SolutionRead the following pie-chart carefully and answer the questions given below :
Distribution of total voters from six different cities and the distribution of female voters among these cities.
Total number of voters=64000
Ratio of males and females = 5 : 3
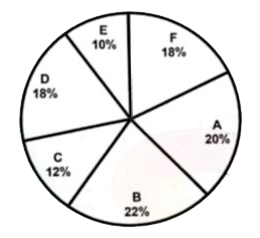
Percentage distribution of female voters
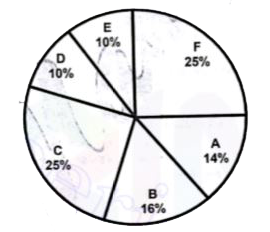
In which two cities the ratio between the female voters is 7 : 8 ?
View SolutionThe pie chart given below shows sale of different types of cars in a city for a given year. The total sale of cars in the city is 600000.
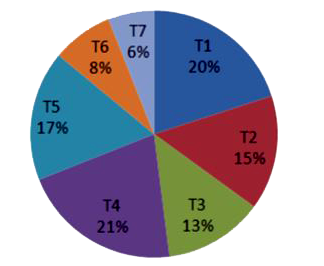
How many T4 cars are sold in the city for the given year?
View Solution
