Bar chart given below shows total number of items sold by five companies and table shows the percentage of items which are rejected (due to some defect in them) by customers out of total items sold by respective companies.
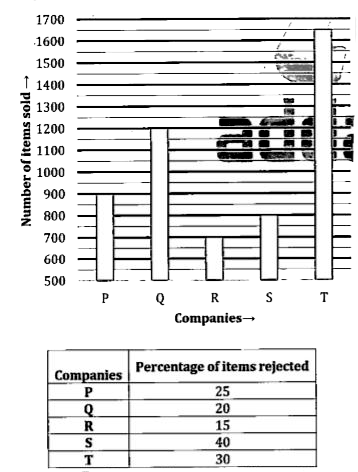
What is the difference between no. of items which are sold by company R and T, which are not rejected by customers?
None of these
420
520
560
The correct Answer is:D
Step by step video & image solution for Bar chart given below shows total number of items sold by five companies and table shows the percentage of items which are rejected (due to some defect in them) by customers out of total items sold by respective companies. What is the difference between no. of items which are sold by company R and T, which are not rejected by customers? by Maths experts to help you in doubts & scoring excellent marks in Class 14 exams.
Updated on:21/07/2023Topper's Solved these Questions
- DATA INTERPRETATIONBOOK - ADDA247CHAPTER - DATA INTERPRETATIONEXERCISE - Mains Questions
33 Videos
- DATA INTERPRETATIONBOOK - ADDA247CHAPTER - DATA INTERPRETATIONEXERCISE - Previous Year Questions
56 Videos
- DATA INTERPRETATIONBOOK - ADDA247CHAPTER - DATA INTERPRETATIONEXERCISE - Prelims Questions (Level-1)
54 Videos
- BOAT AND STREAM BOOK - ADDA247CHAPTER - BOAT AND STREAM EXERCISE - Previous Year Question
22 Videos
- DATA SUFFICIENCY BOOK - ADDA247CHAPTER - DATA SUFFICIENCY EXERCISE - PREVIOUS YEAR QUESTIONS
25 Videos
Similar Questions
Pie chart given below shows total number of workers in three different companies. Table given below shows ratio between officers and workers working in these companies. Study the data carefully and answer the following questions
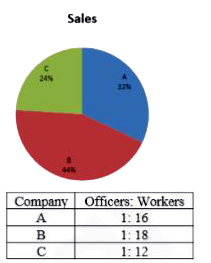
Note: total employees = officers + workers
Find the ratio between total number of workers in company A and C together to total number of officers in company A and C together?
View SolutionPie chart given below shows total number of workers in three different companies. Table given below shows ratio between officers and workers working in these companies. Study the data carefully and answer the following questions
Total workers =900
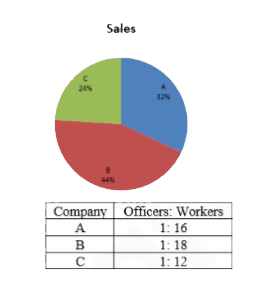
Note: total employees = officers + workers
Find the difference between total number of workers in company ‘A’ and total number of workers in company ‘B’ and ‘C’ together?
View Solution
Knowledge Check
A shop reduced its prices by 10% . What is the new price of an item which was previously sold for Rs. 500 ?
ARs. 550BRs. 450CRs. 400DRs. 510The bar chart given below shows the number of cars sold by brand A and B for the year for 2008 to 2016
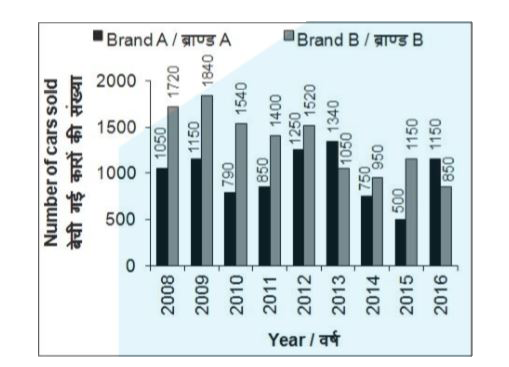
What is the percentage decrease in the number of car sold in year 2015 from year 2014 for brand A?A50B20C25D33.33The bar chart given below shows the sales (in '000 units) of 4 mobile brands for 3 years.
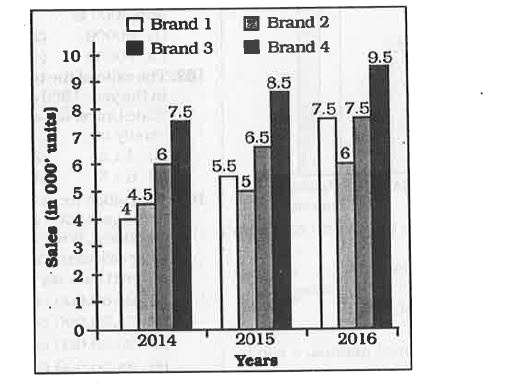
What is the percentage increase in the total number of mobiles sold by these four brands from 2014 to 2016?A42.16B38.63C32.43D30.16
Study the following table, (which shows the number of units of an item manufactured and sold by 5 companies) and answer the question.
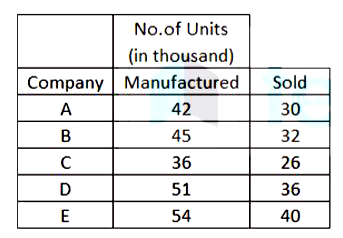
What percent of total number of units sold by companies A, B and D is equal to the number of units manufactured by company C? (correct to one decimal place)
View SolutionPie chart given below shows total number of workers in three different companies. Table given below shows ratio between officers and workers working in these companies. Study the data carefully and answer the following questions
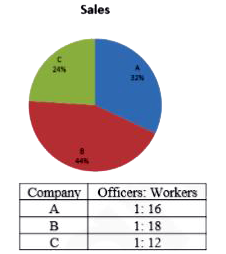
Note: total employees = officers + workers
Total number of officers in company ‘A’ is how much less than total number of officers in company ‘B’?
View SolutionRead the following information and answer the four items that follow :
Let the distribution of number of scooters of companies X and Y sold by 5 showrooms (A, B, C, D and E) in a certain year be denoted by S1 and the distribution of number of scooters of only company X sold by the five showrooms in the same year be denoted by S2.
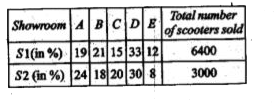
What is the difference between the number of scooters of both companies sold by showroom A and total number of scooters of company X sold by showrooms B and E together?
View SolutionThe bar chart given below shows the sales (in '000 units) of 4 mobile brands for 3 years.
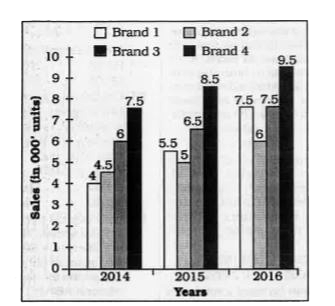
What is the percentage increase in the total number of mobiles sold by these four brands from 2014 to 2016?
View SolutionThe bar chart given below shows the sales (in crores) of 2 companies A and B from years 2010 to 2015.
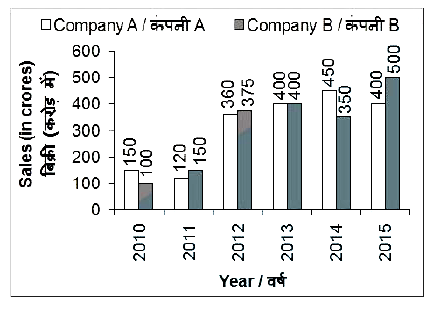
What is the difference (in crores) between the sales of company A in 2012 and company B in 2015?
View Solution
