Bar chart given below shows total number of items sold by five companies and table shows the percentage of items which are rejected (due to some defect in them) by customers out of total items sold by respective companies.
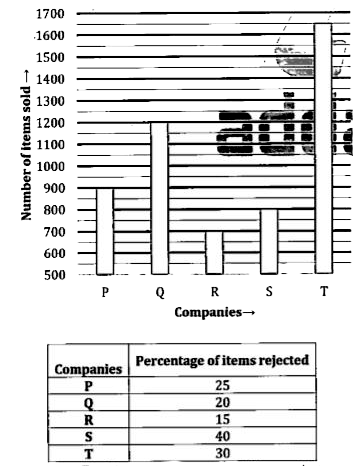
Rejected items by customers to company Q is what percent of rejected items by customers to company S?
The correct Answer is:B
Step by step video, text & image solution for Bar chart given below shows total number of items sold by five companies and table shows the percentage of items which are rejected (due to some defect in them) by customers out of total items sold by respective companies. Rejected items by customers to company Q is what percent of rejected items by customers to company S? by Maths experts to help you in doubts & scoring excellent marks in Class 14 exams.
Topper's Solved these Questions
- BOOK - ADDA247CHAPTER - DATA INTERPRETATIONEXERCISE - Mains Questions33videos
DATA INTERPRETATION
- BOOK - ADDA247CHAPTER - DATA INTERPRETATIONEXERCISE - Previous Year Questions56videos
DATA INTERPRETATION
- BOOK - ADDA247CHAPTER - DATA INTERPRETATIONEXERCISE - Prelims Questions (Level-1)54videos
DATA INTERPRETATION
- BOOK - ADDA247CHAPTER - BOAT AND STREAM EXERCISE - Previous Year Question22videos
BOAT AND STREAM
- BOOK - ADDA247CHAPTER - DATA SUFFICIENCY EXERCISE - PREVIOUS YEAR QUESTIONS25videos
DATA SUFFICIENCY
Similar Questions
Pie chart given below shows total number of workers in three different companies. Table given below shows ratio between officers and workers working in these companies. Study the data carefully and answer the following questions
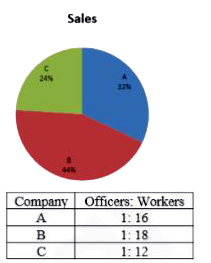
Note: total employees = officers + workers
Find the ratio between total number of workers in company A and C together to total number of officers in company A and C together?View SolutionThe table given below shows production of five types of cars by a company from the 1998 to 2003. Study the table and answer the questions.
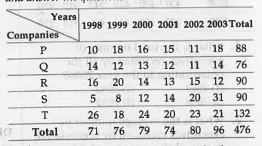
What is the ratio of total number of cars produced by all the companies together in the years 2003 and 1999?View Solution
Knowledge Check
- Question 1 - Select One
Items sold in 2014 is how much percent more than items produced by company in 2017.
A50.88%B42.8%C55.88%D65.88% - Question 2 - Select One
The bar chart given below shows the sales (in crores) of 2 companies A and B from years 2010 to 2015.
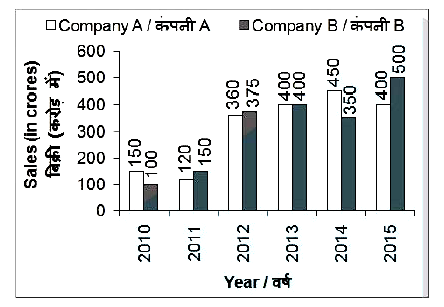
What is the percentage change in sale of company B from years 2011 to 2012?A100B225C150D125 - Question 3 - Select One
The bar chart given below shows thes sales (in lacs) of 2 companies X and Y from year 2011 to 2016
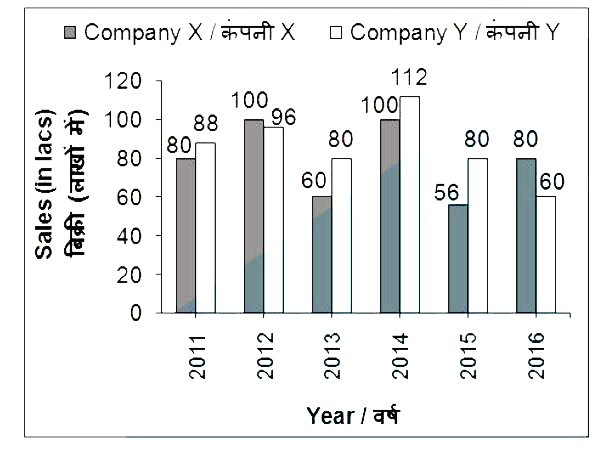
What was the percentage change in the sale of company X from year 2011 to 2015?A30B80C50D60
Pie chart given below shows total number of workers in three different companies. Table given below shows ratio between officers and workers working in these companies. Study the data carefully and answer the following questions . total workers = 900
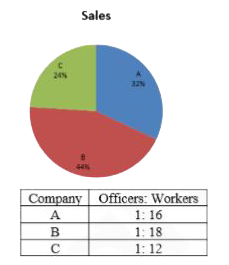
Note: total employees = officers + workers
Total number of employees in company ‘B’ is how much more than total number of employees in company ‘C’.View SolutionPie chart given below shows total number of workers in three different companies. Table given below shows ratio between officers and workers working in these companies. Study the data carefully and answer the following questions
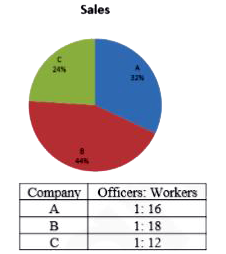
Note: total employees = officers + workers
Total number of officers in company ‘A’ is how much less than total number of officers in company ‘B’?View SolutionStudy the following table, (which shows the number of units of an item manufactured and sold by 5 companies) and answer the question.
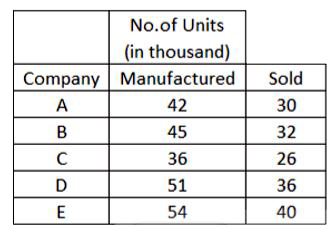
Which Company sold the highest percentage of units as compared to manufactured by it?View SolutionStudy the following table, (which shows the number of units of an item manufactured and sold by 5 companies) and answer the question.
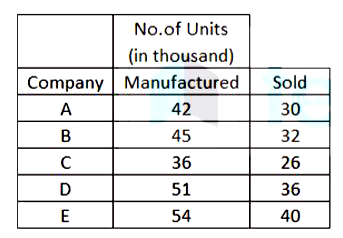
What percent of total number of units sold by companies A, B and D is equal to the number of units manufactured by company C? (correct to one decimal place)View SolutionThe bar chart given below shows the sales (in lacs) of 2 companies X and Y and Y from year 2011 to 2016
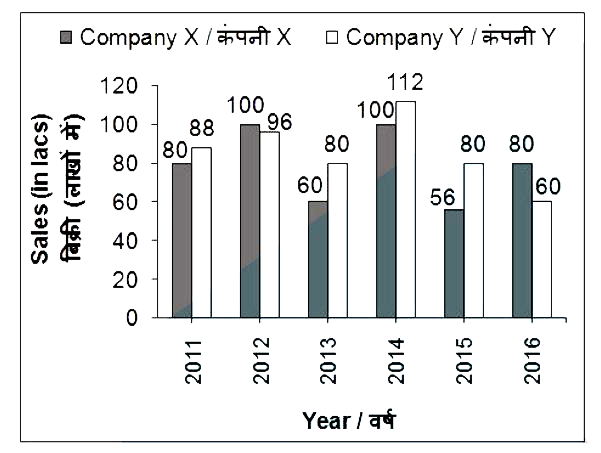
The sale of company Y in 2015 is what percent of the sale of company X in 2011?View Solution

