Given table shows the number of applications filled for three various exams (CAT, MAT & SAT) and applicants who attempted these exams in years 2018, 2019 & 2020. Read the data carefully and answer the questions. (Some data are missing which you have to calculate as per information provided in question)

(exam & year is in format i.e. CAT 2018 is written as CAT' 18)
(Each applicant filled only one form and there are only these 3 exams)
How many applicants filled CAT'20?
I. no. of applicants who attempted CAT'18 is same as no. of applicants who filled MAT'19.
II. no. of applicants who did not attempt CAT in all given years together is equal to no. of applicants who did not attempt MAT in all given years together.
Both statements together are necessary
Either statement I alone or II alone is sufficient
Only statement I alone is sufficient
Both statements together are not sufficient
The correct Answer is:D
Step by step video, text & image solution for Given table shows the number of applications filled for three various exams (CAT, MAT & SAT) and applicants who attempted these exams in years 2018, 2019 & 2020. Read the data carefully and answer the questions. (Some data are missing which you have to calculate as per information provided in question) (exam & year is in format i.e. CAT 2018 is written as CAT' 18) (Each applicant filled only one form and there are only these 3 exams) How many applicants filled CAT'20? I. no. of applicants who attempted CAT'18 is same as no. of applicants who filled MAT'19. II. no. of applicants who did not attempt CAT in all given years together is equal to no. of applicants who did not attempt MAT in all given years together. by Maths experts to help you in doubts & scoring excellent marks in Class 14 exams.
Topper's Solved these Questions
- BOOK - ADDA247CHAPTER - DATA INTERPRETATIONEXERCISE - Previous Year Questions56videos
DATA INTERPRETATION
- BOOK - ADDA247CHAPTER - DATA INTERPRETATIONEXERCISE - Prelims Questions (Level-2)59videos
DATA INTERPRETATION
- BOOK - ADDA247CHAPTER - BOAT AND STREAM EXERCISE - Previous Year Question22videos
BOAT AND STREAM
- BOOK - ADDA247CHAPTER - DATA SUFFICIENCY EXERCISE - PREVIOUS YEAR QUESTIONS25videos
DATA SUFFICIENCY
Similar Questions
Knowledge Check
- Question 1 - Select One
Select the most appropriate option to improve the underlined segment in the given sentence. If there is no need to improve it, select "No improvement".
I have prepared well for the exam and am ready to answer any questionAwill preparedBNo improvementCpreparingDmay prepare - Question 2 - Select One
The table given below shows the number of applicants who have applied for exam at various centres as percentage of total number of applicants. The table also shows the number online applicants and absent applicants as a percentage of total applicants of each centre. Total number of applicants is 1200000.

If A equals to 15% of total applicants who are present at exam centre F and B equals to present applicants at exam centre K, then A is what per cent of B?A(a) 18.18B(b) 11.25C(c) 13.33D(d) 14.28 - Question 3 - Select One
The table given below shows the number of applicants who have applied for exam at various centres as percentage of total number of applicants. The table also shows the number online applicants and absent applicants as a percentage of total applicants of each centre. Total number of applicants is 1200000.

What are the total number of present applicants from exam centre H and G together?A238200B151800C388200D442650
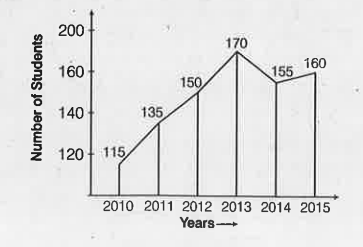
Following line graph shows the number of students who qualified in an exam during various years. Study the graph carefully and answer the question.

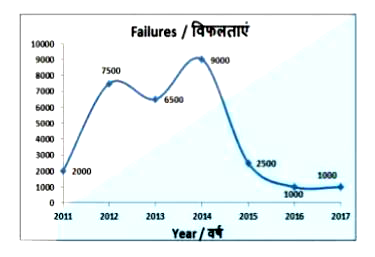
Find the percentage in increase in the number of students who qualified the exam in the year 2013 as compared to 2012.View SolutionThe line graph shows the number of students of a certain university who failed in the given year in their final exams. Study the diagram and answer the following questions

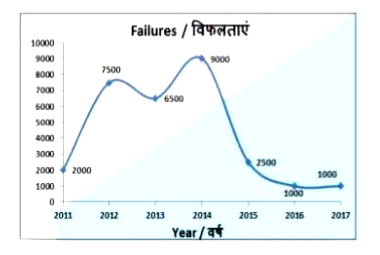
What is the average number of failures in the last three years?View SolutionThe line graph shows the number of students of a certain university who failed in the given year in their final exams. Study the diagram and answer the following questions

In which year were failures greater than that of the previous year?View SolutionStatements: All cats are bats.
All bats are tables.
Conclusions: (i) Some tables are bats.
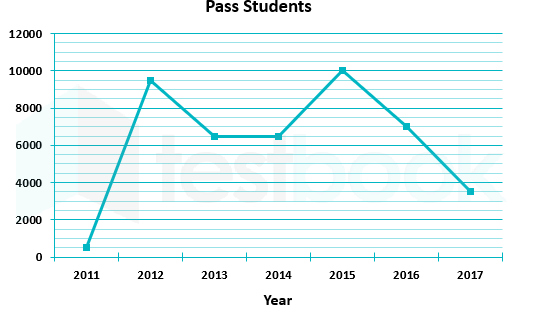
(ii) Some tables are cats.View SolutionThe line graph shows the number of students of a certain university who passed in the given year in their final exams. Study the diagram and answer the following questions.

If students who pass are given a certificate, what is the number of certificates awarded in the last three years?View Solution


