गंगा लि. ने 1 जनवरी, 2014 को 5,50,000 में एक मशीन खरीदी | इसकी स्थापना पर 50,000 रु. व्यय किये गए | 1 सितंबर, 2014 को 3,70,000 रु. में एक और मशीन खरीदी | 01 मई, 2015 को 8,40,000 रु. (स्थापना व्यय सहित) में एक और मशीन खरीदी |
प्रतिवर्ष 31 दिसंबर को 10% वार्षिक से सीधी रेखा पद्धति ह्रास लगाया गया |
वर्ष 2014, 2015, 2016 एवं 2017 के लिए मशीन खाता एवं मूल्य ह्रास खाता बनाए |
1.01.2015 को मशीन खाते का शेष 12,22,666 रु.
Topper's Solved these Questions
Similar Questions
संदिग्ध ऋणों के लिए सीमा से अधिक प्रावधान करने से व्यवसाय में गुप्त संचय एकत्रित हो जाता है |
View Solutionउदाहरण सहित परिपक्वता तिथि की गणना प्रक्रिया को समझाइए |
View Solutionएक फैक्टरी दो पदार्थो A और B का निर्माण करती है|पदार्थ A के निर्माण हेतु एक मशीन को 1 .5 घंटे तथा साथ ही एक मिस्त्री को 2 घंटे कार्य करना पढता है|पदार्थ B के निर्माण हेतु मशीन को 2 .5 घंटे तथा मिस्त्री को 1 .5 घण्टे कार्य करना पढता है| प्रति सप्ताह फैक्टरी मशीन को 80 घंटे तथा कारीगरी को 70 घंटे उपलब्ध करात्ती है| प्रत्येक पदार्थ A पर लाभ रु 5 तथा प्रत्येक पदार्थ B पर लाभ रु 4 है| यदि निर्मित सभी पदार्थ बिक जाएँ तो ज्ञात कीजिए की प्रति सप्ताह अधिकतम लाभ के लिए प्रत्येक प्रकार के कितने पदार्थ बनाये जाएँ ?
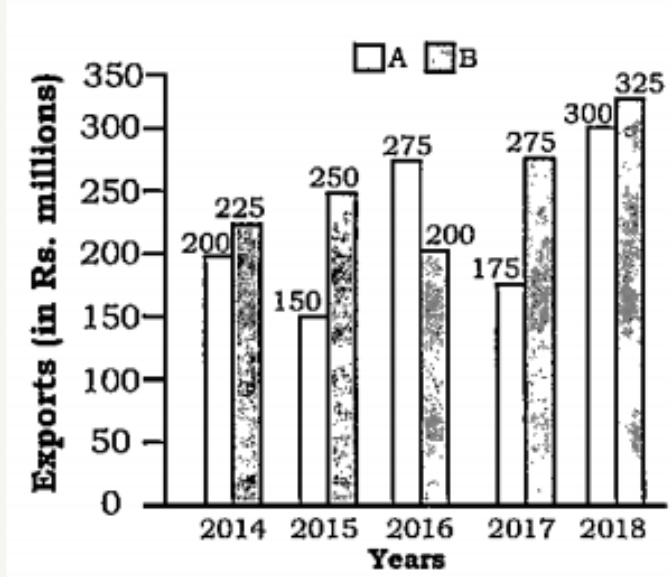
View SolutionThe bar graph shows the exports of Cars of Type A and B (in Rs. million).
दिए गए दंड आरेख में टाइप A और B कारो के निर्यात को दर्शाया गया है (मिलियन रु. में) What is the ratio of the exports of cars of Type A in 2014 and 2018 to the total exports of cars of type B in 2015 and 2016?
2014 और 2018 में टाइप A कारो के कुल निर्यात और 2015 और 2016 में टाइप B कारो के कुल निर्यात का अनुपात क्या हे?
View SolutionSalary of A increased by 8% in the year 2015 as compared to 2014 and decreased by 6% in the year 2016 as compared to 2015. If his salary was Rs.2,34,778 in 2016, his salary (round off to nearest whole number) in 2014 was :
A के वेतन में वर्ष 2014 के मुकाबले वर्ष 2015 में 8% की वृद्धि हुई और 2015 के मुकाबले वर्ष 2016 में 6% की कमी हुई | यदि वर्ष 2016 में उसका वेतन रु 2, 34, 778 था तो 2014 में उसका वेतन (निकटतम संपूर्ण संख्या में पूर्णाकित) कितना था?
View SolutionA person bought a bike and a car for Rs. 500000. He sold the bike at a profit of 20% and the car at a loss of 10% and in the whole deal he managed to get a profit of 5%. Find the cost ( in Rs ) of the Bike.
किसी व्यक्ति ने रु 500000 में एक बाइक और एक कार खरीदी | उसने बाइक को 20% लाभ पर और कार को 10% हानि पर बेच दिया और इस प्रकार पुरे सौदे में उसे 5%का लाभ प्राप्त हुआ | बाइक की कीमत (रु में) है:
View SolutionA company bought a machine for Rs. 40000 and spent Rs. 10000 on its repairing. Later, the machine was sold for Rs. 45000. The discount offered was :
एक कंपनी ने 40000 रूपए में एक मशीन खरीदी और 10000 रूपए उसकी मरम्मत पर खर्च किए | कुछ समय बाद, मशीन को 45000 रूपए में बेच दिया गया | कितनी छूट की पेशकश की गयी ?
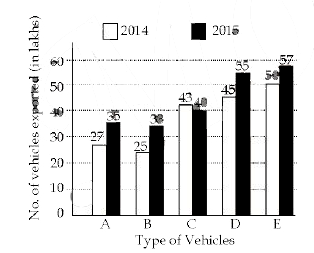
View SolutionThe given bar graph presents the number of different types of vehicles (in lakhs) exported by a company during 2014 and 2015. दिया गया दंड आरेख एक कंपनी के द्वारा 2014 और 2015 में निर्यात किये गए अलग-अलग प्रकार के वाहनों की संख्या ( लाख में ) को दर्शाता है | What is the ratio of the total number of type A and C vehicles exported in 2014 to the total number of type B and E vehicles exported in 2015? 2014 में निर्यात किये गए A और C प्रकार के वाहनों की कुल संख्या का 2015 में निर्यात किये गए B एवं E प्रकार के वाहनों की कुल संख्या के साथ अनुपात ज्ञात करें |
View SolutionThe given bar graph presents the number of different types of vehicles (in lakhs) exported by a company during 2014 and 2015. दिया गया दंड आरेख एक कंपनी के द्वारा 2014 और 2015 में निर्यात किये गए अलग-अलग प्रकार के वाहनों की संख्या ( लाख में ) को दर्शाता है | Which type of vehicle showed 32% increase in export in 2015 as compared to that in the previous year? किस प्रकार के वाहन के निर्यात में पिछले वर्ष की तुलना में 2015 में 32% की वृद्धि देखने को मिली ?
View SolutionThe given bar graph presents the number of different types of vehicles (in lakhs) exported by a company during 2014 and 2015.
दिया गया दंड आरेख एक कंपनी के द्वारा 2014 और 2015 में निर्यात किये गए अलग-अलग प्रकार के वाहनों की संख्या ( लाख में ) को दर्शाता है | The average number of type A, B and D vehicles exported in 2015 was x% less than the number of type E vehicles exported in 2014. What is the value of x?
2015 में निर्यात किये गए A, B और D प्रकार के वाहनों की औसत संख्या 2014 में निर्यात किये गए E प्रकार के वाहनों की संख्या से x% कम थी | x का मान क्या है ?
View SolutionThe given Bar Graph presents Income and Expenditure (in crores of Rupees) of a company for the five years, 2014 to 2018. दिया गया दंड आरेख पांच वर्षों अर्थात 2014 से 2018 तक एक कंपनी के आय एवं व्यय ( करोड़ रुपये में ) को दर्शाता है | The average Income (per year) of the company in five years is what percentage more than its Expenditure in 2015? पांच वर्षों में कंपनी की औसत आय (प्रति वर्ष ) 2015 में इसके व्यय से कितना प्रतिशत अधिक है ?
View SolutionThe given Bar Graph presents Income and Expenditure (in crores of Rupees) of a company for the five years, 2014 to 2018. दिया गया दंड आरेख पांच वर्षों अर्थात 2014 से 2018 तक एक कंपनी के आय एवं व्यय ( करोड़ रुपये में ) को दर्शाता है | In which year is the Expenditure more than 40% as compared to the Expenditure in the previous year? किस वर्ष में व्यय पिछले वर्ष के व्यय की तुलना में 40% अधिक है ?
View SolutionThe given Bar Graph presents Income and Expenditure (in crores of Rupees) of a company for the five years, 2014 to 2018. दिया गया दंड आरेख पांच वर्षों अर्थात 2014 से 2018 तक एक कंपनी के आय एवं व्यय ( करोड़ रुपये में ) को दर्शाता है | What is the ratio of total Expenditure to total Income of the company in 2014, 2016 and 2017? 2014, 2016 और 2017 में कंपनी के कुल व्यय और कुल आय में क्या अनुपात है ?
View SolutionThe given Bar Graph presents Income and Expenditure (in crores of Rupees) of a company for the five years, 2014 to 2018. दिया गया दंड आरेख पांच वर्षों अर्थात 2014 से 2018 तक एक कंपनी के आय एवं व्यय ( करोड़ रुपये में ) को दर्शाता है | What is the ratio of the total revenue of the company in 2015 and 2018 to that of its expenditure in 2014 and 2018? 2015 तथा 2018 में कंपनी की कुल आय और 2014 तथा 2018 में कंपनी के कुल व्यय में क्या अनुपात है ?
View SolutionThe given Bar Graph presents Income and Expenditure (in crores of Rupees) of a company for the five years, 2014 to 2018. दिया गया दंड आरेख पांच वर्षों अर्थात 2014 से 2018 तक एक कंपनी के आय एवं व्यय ( करोड़ रुपये में ) को दर्शाता है | The expenditure of the company in 2017 is what percentage less than the average revenue (per year) in 2014, 2015 and 2016? 2017 में कंपनी का व्यय 2014, 2015 और 2016 की औसत आय ( प्रति वर्ष) से कितना प्रतिशत कम है ?
View SolutionThe given Bar Graph presents the data of annual income (A) and annual expenditure (B) of an IT officer in a multi-national company during the years 2012 to 2016. दिया गया दंड आरेख वर्ष 2012 से 2016 के दौरान किसी बहुराष्ट्रीय कंपनी में कार्यरत एक आईटी अधिकारी अधिकारी की वार्षिक आय ( A ) और वार्षिक व्यय (B) के आंकड़ों को दर्शाता है | What was his average monthly savings (in Rs) in 2015 and 2016, taken together (correct to two decimal places)? 2015 और 2016 को मिलाकर उसकी औसत मासिक बचत ( रुपये में ) कितनी थी ? ( दशमलव के दो स्थान तक )
View Solution
