Given below are three pie charts showing consumption habits of India. China and World overall in 2008. Write an analytical paragraph describing the pie charts (100-120 words).
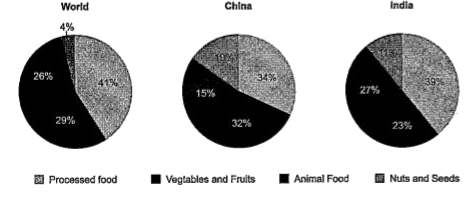
The three given pie charts depict types of food consumption in 2008 as compared in two countries- India and China. In general, processed food is the major type of food eaten. Processed food comprises as high as 41% of the global consumption. In China and India as well, processed foods are consumed the most, the rate of consumption being 34% and 39% respectively. On an average, vegetables and fruits constitute 29% of consumption. In China, vegetables and fruits comprise 32% of food consumption which is 9% more than that of India. For Indians, animal food accounts for 27% of their diet, exceeding Chinese food consumption by a striking 12%. However, nuts and seeds comprise almost one-fifth of Chinese food habits. This is way more than the global consumption of 4% and 11% of India. Overall, world food consumption largely comprises processed food. Chinese consumption of nuts and seeds is unbelievably higher than the average percentage.
Similar Questions
The below given pie chart highlights causes of Road Rage. Write an analytical paragraph of about 100-120 words briefly summarising the information.

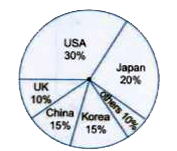
View SolutionThe following pie chart shows the foreign Direct Investment in India during 2019-2020. Write an analytic paragraph showing the general trends and the necessary details. Compare the segments where relevant.
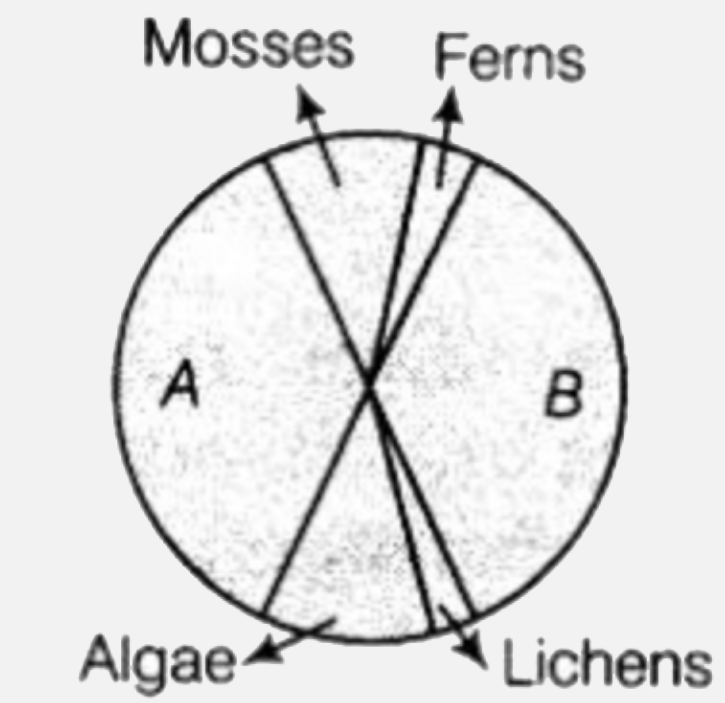
View SolutionObserve the pie chart given below showing biodiversity and identify 'a' and 'b'
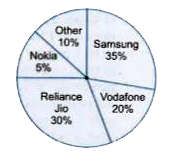
View SolutionThe pie chart given below represents the sales of mobile phones of the leading companies of the world in India. Summarise and analyse the chart in your own language in about 150-200 words. Give all necessary details and compare the segments where relevant.
View SolutionThe following pie chart represents the distribution of the overseas tourists and their age profile respectively. Study the chart carefully and write an analytic paragraph (150- 200 words) giving the general trends and other necessary details. Don' forget to compare the segments where relevant.
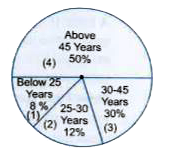
View SolutionFill in the blanks : The given pie chart shows the information on consumption of different soap powders in a survey Brand Consumption :
View SolutionThe pie-chart given below illustrates how internet users of aged 17+ prefer to browse the web. Summarise by writing an analytic paragraph in 150-200 words given necessary details and the general trend. Compare where relevant.
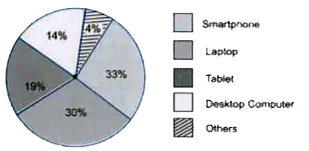
View SolutionThe given pie chart shows runs scored by A in 6 matches
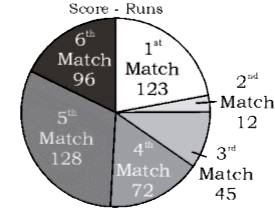
In the given pie chart what is the average runs scored in all matches
View SolutionGiven below is the result of an annual examination of a class, showing the percentage of students in each category .

Represent the above data by a pie chart.
View SolutionThis question is to be answered on the basis of the pie chart given below showing how a person's monthly salary is distributed over different expanse heads
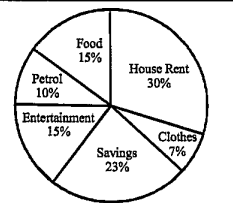
The angle made at the centre of the pie chart by the sector representing the expanse on petrol is
View Solution
