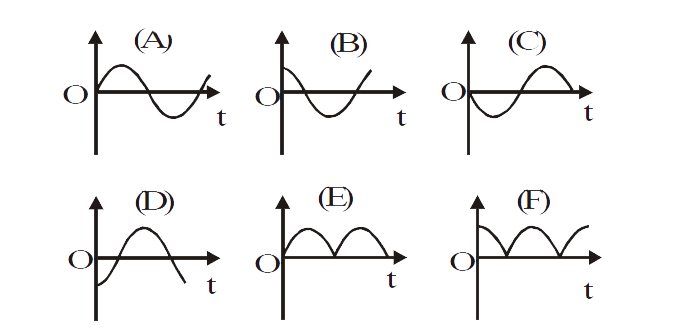
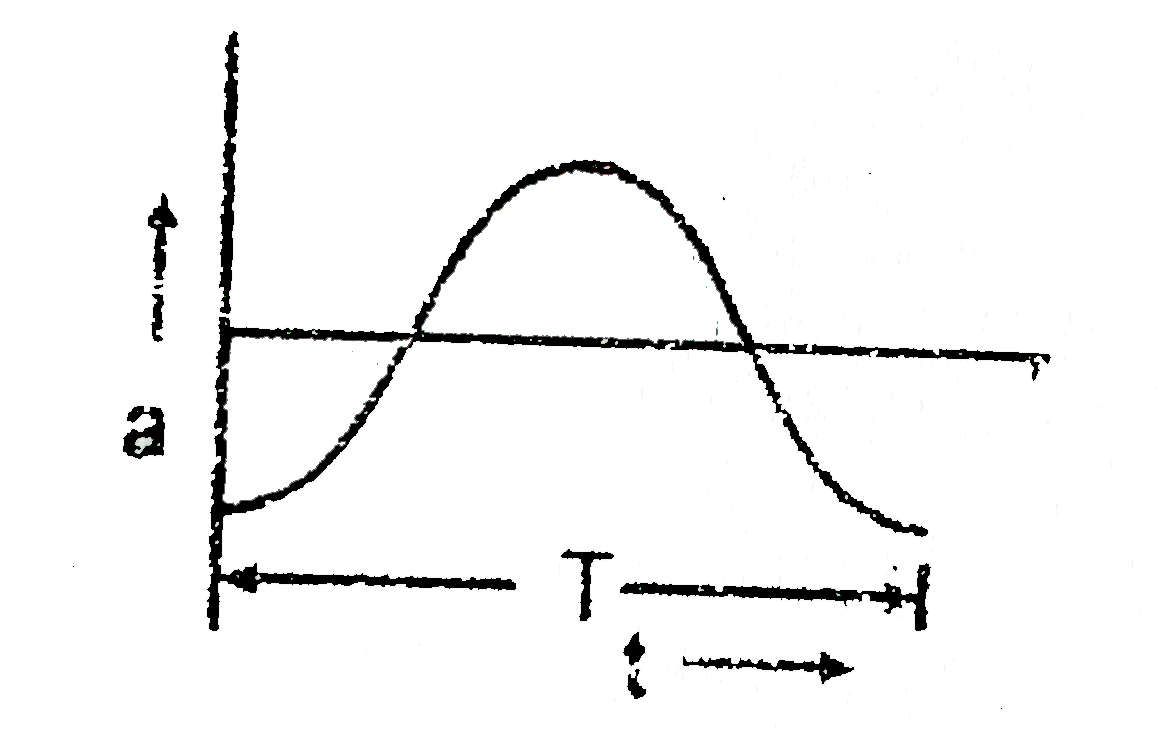
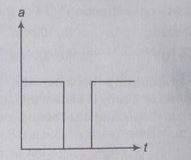
Acceleration A and time period T of a body in S.H.M. is given by a curve shown below. Then corresponding graph, between kinetic energy (K.E.) and time t is correctly represented by 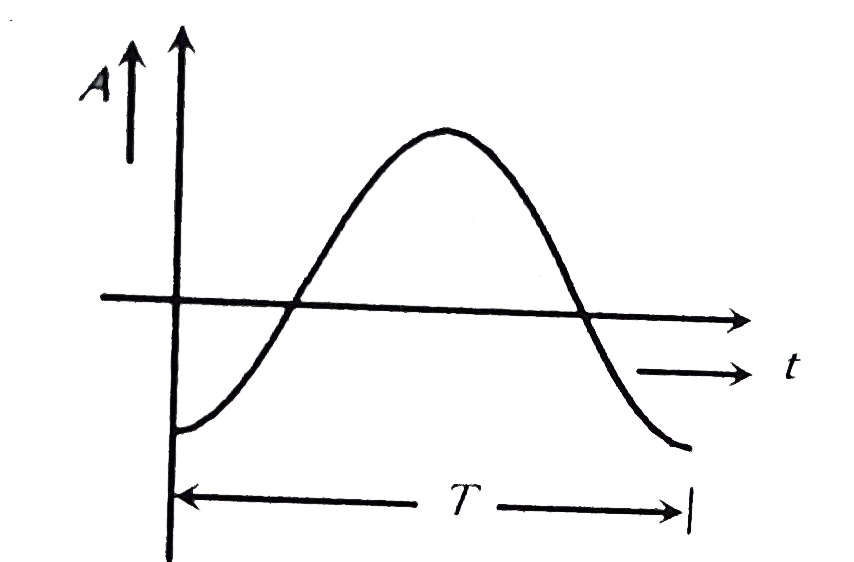
A

B

C

D

Video Solution
Text Solution
The correct Answer is:A
For a=0, v=vmax⇒KE=max.
|
Topper's Solved these Questions
- SIMPLE HARMONIC MOTIONBOOK - ERRORLESSCHAPTER - SIMPLE HARMONIC MOTIONEXERCISE - NCERT BASED QUESTIONS (Time Period and Frequency)
7 Videos
- SIMPLE HARMONIC MOTIONBOOK - ERRORLESSCHAPTER - SIMPLE HARMONIC MOTIONEXERCISE - NCERT BASED QUESTIONS (Simple Pendulum)
27 Videos
- SIMPLE HARMONIC MOTIONBOOK - ERRORLESSCHAPTER - SIMPLE HARMONIC MOTIONEXERCISE - NCERT BASED QUESTIONS (Acceleration of Simple Harmonic Motion)
11 Videos
- ROTATIONAL MOTIONBOOK - ERRORLESSCHAPTER - ROTATIONAL MOTIONEXERCISE - Assertion & Reason
25 Videos
- SURFACE TENSIONBOOK - ERRORLESSCHAPTER - SURFACE TENSIONEXERCISE - ASSERTION & REASON
11 Videos
Similar Questions
Knowledge Check
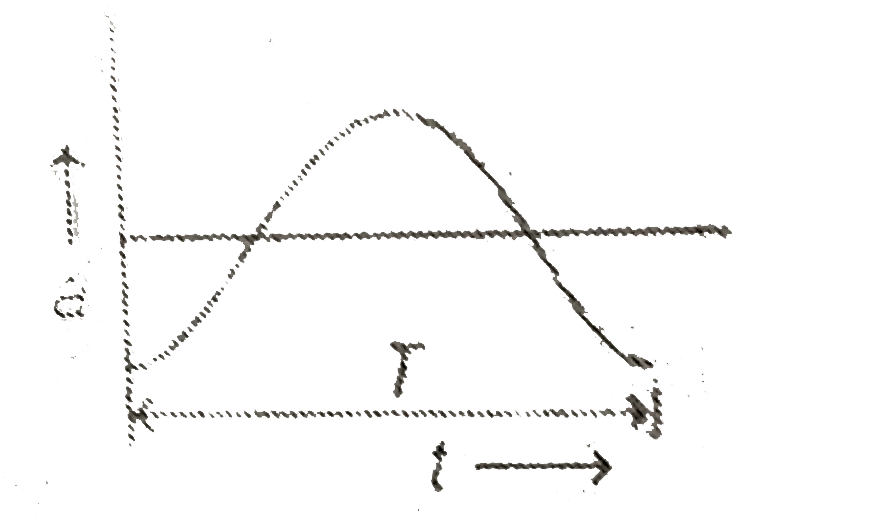
Acceleration versus time graph of a body in SHM is given by a curve shown below. T is the time period. Then corresponding graph between kinetic energy KE and time t is correctly represented by
 A
A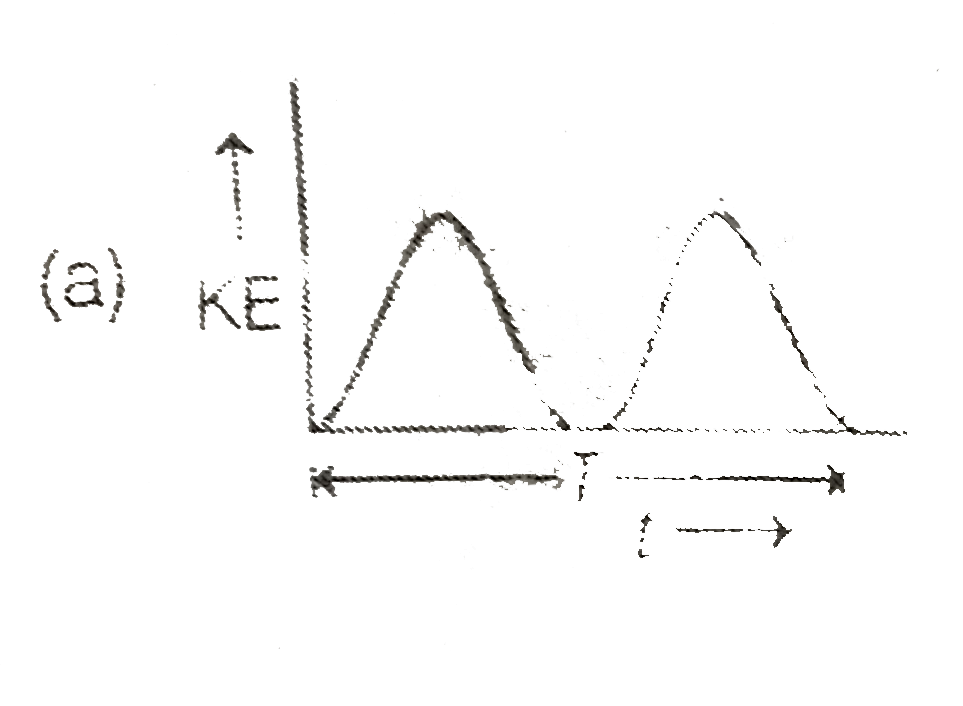 B
B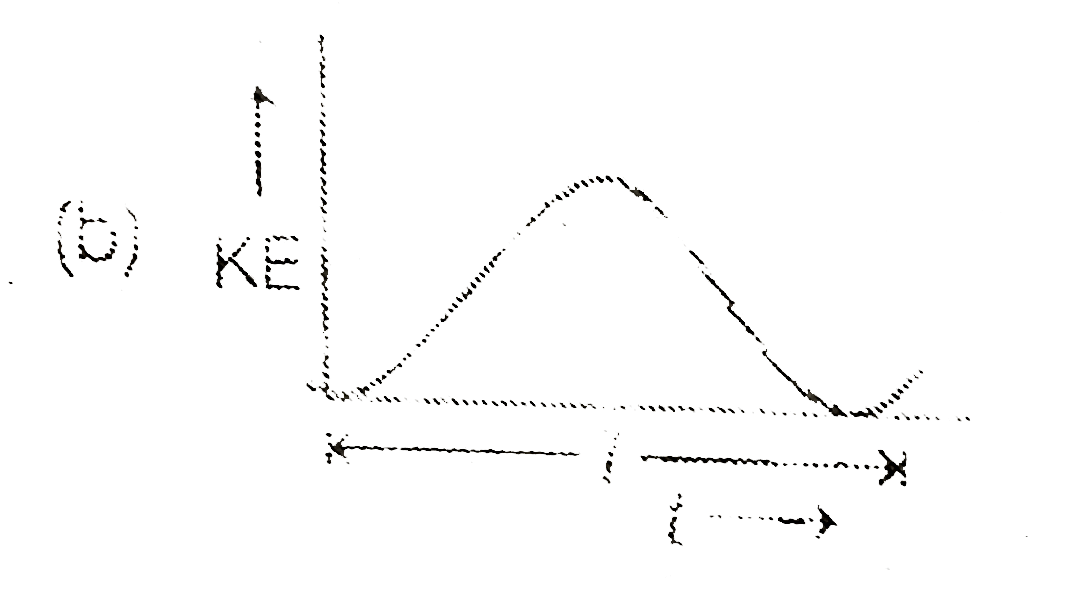 C
C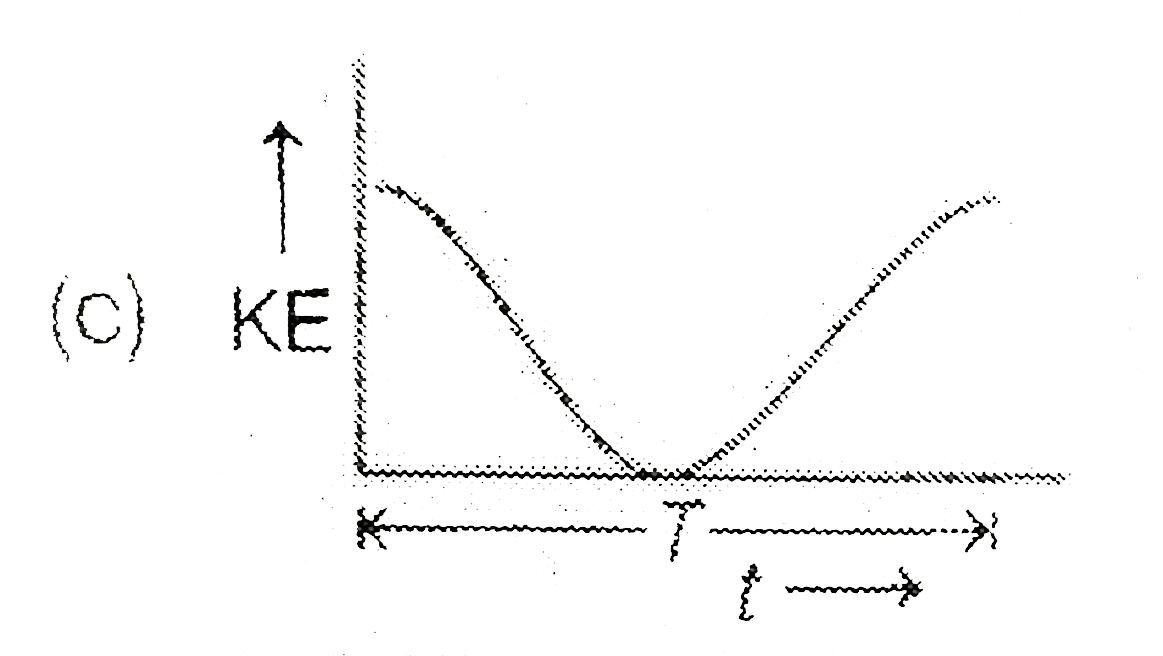 D
D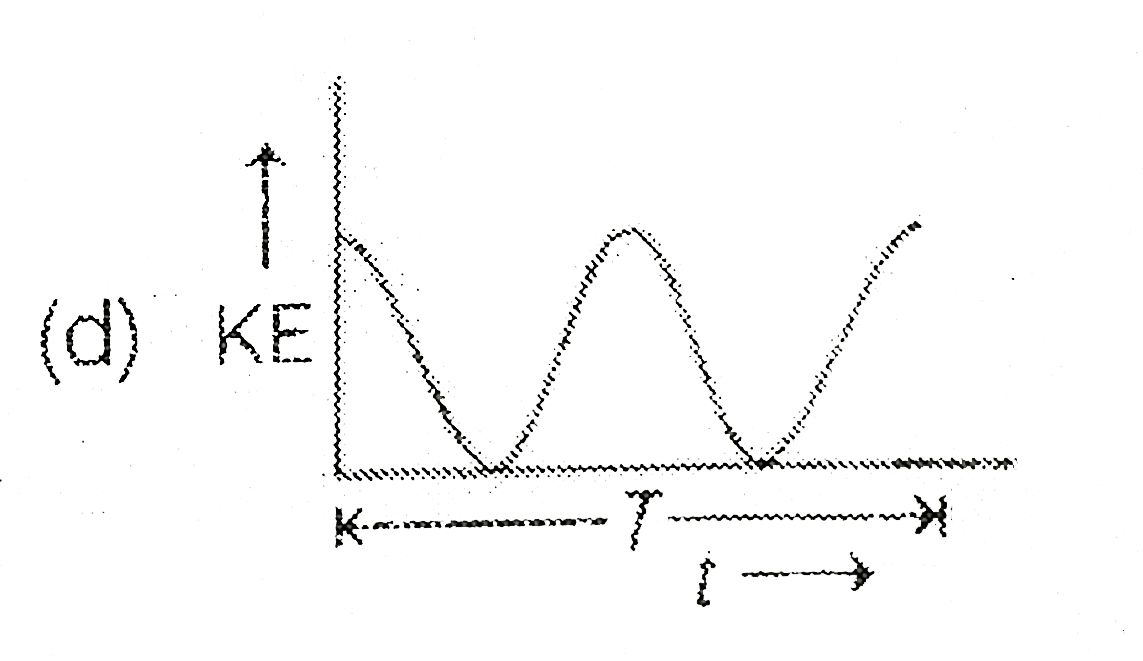
Acceleration a versus time t graph of a body in SHM is given by a curve shown below. T is the time period Then corresponding graph between kinetic energy KE and time t is correctly represented by
 A
A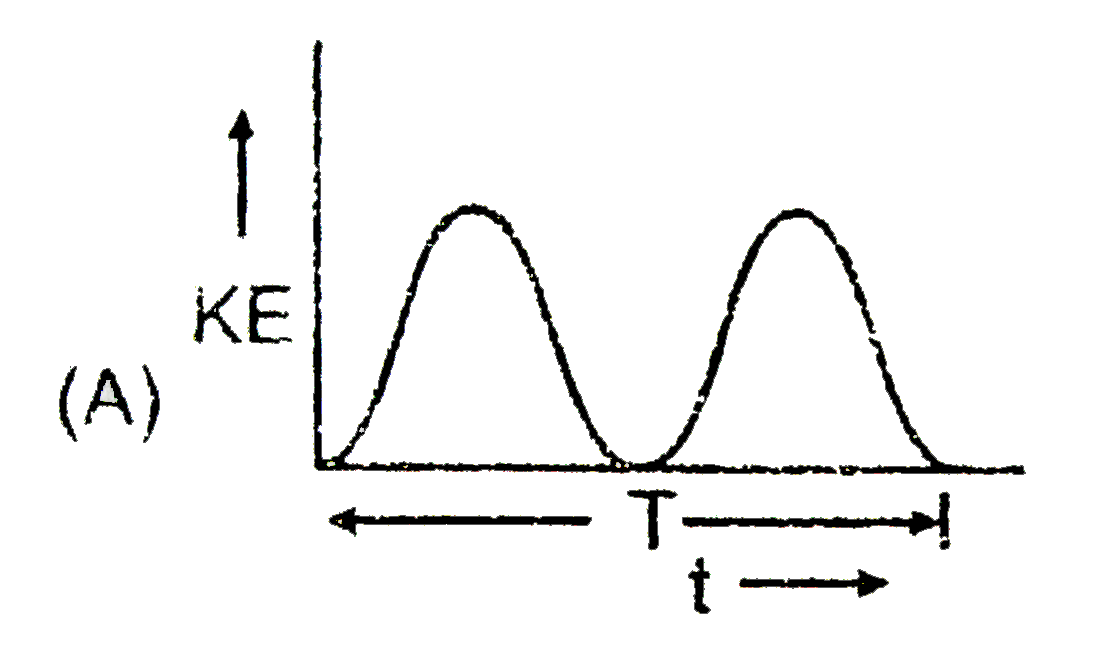 B
B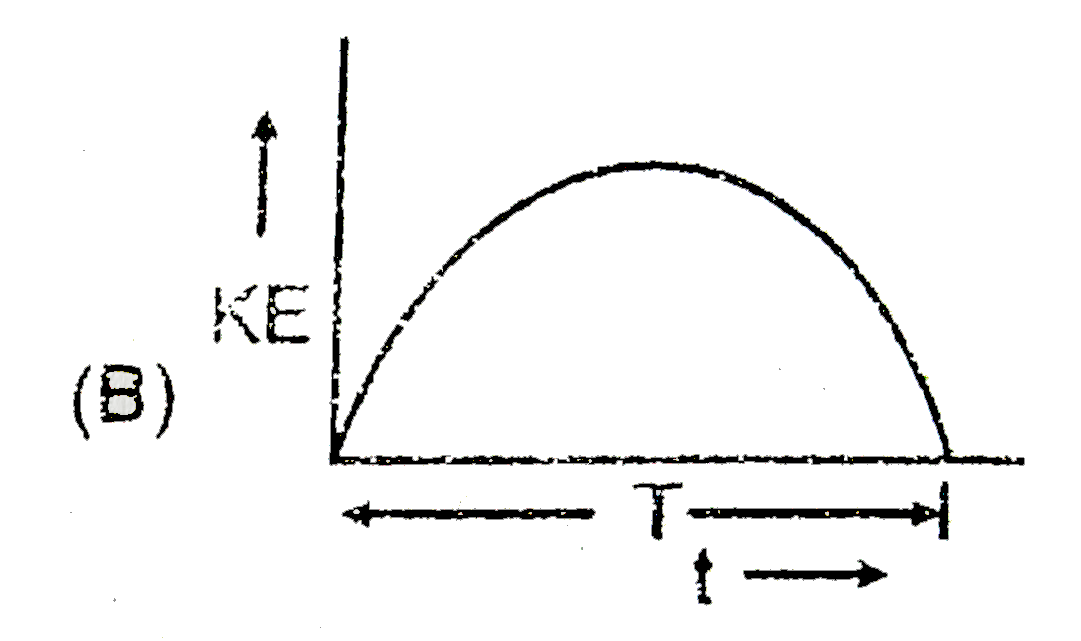 C
C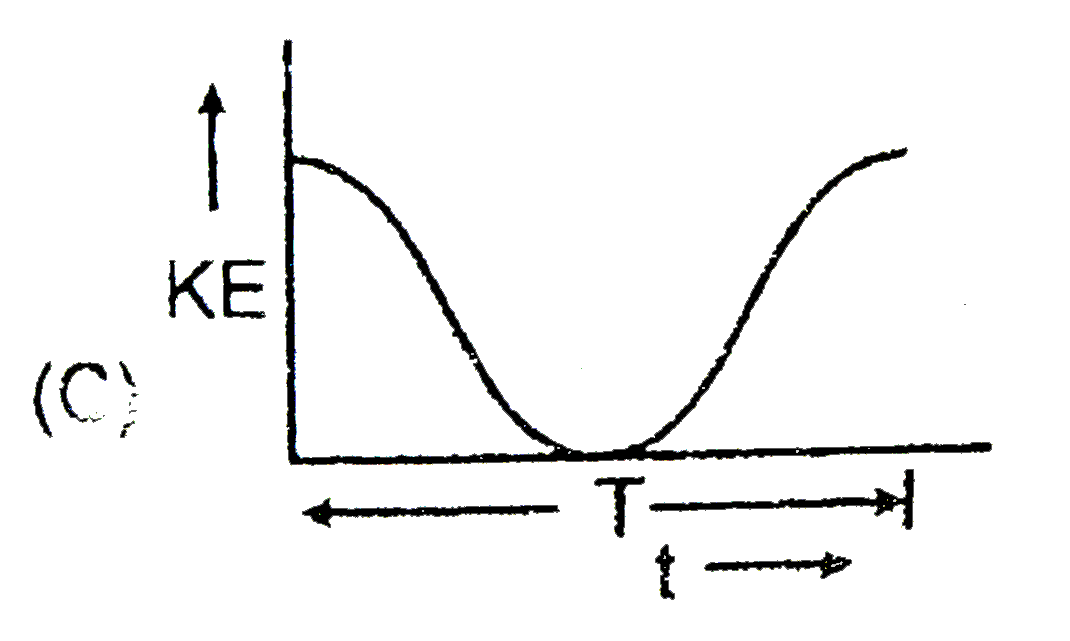 D
D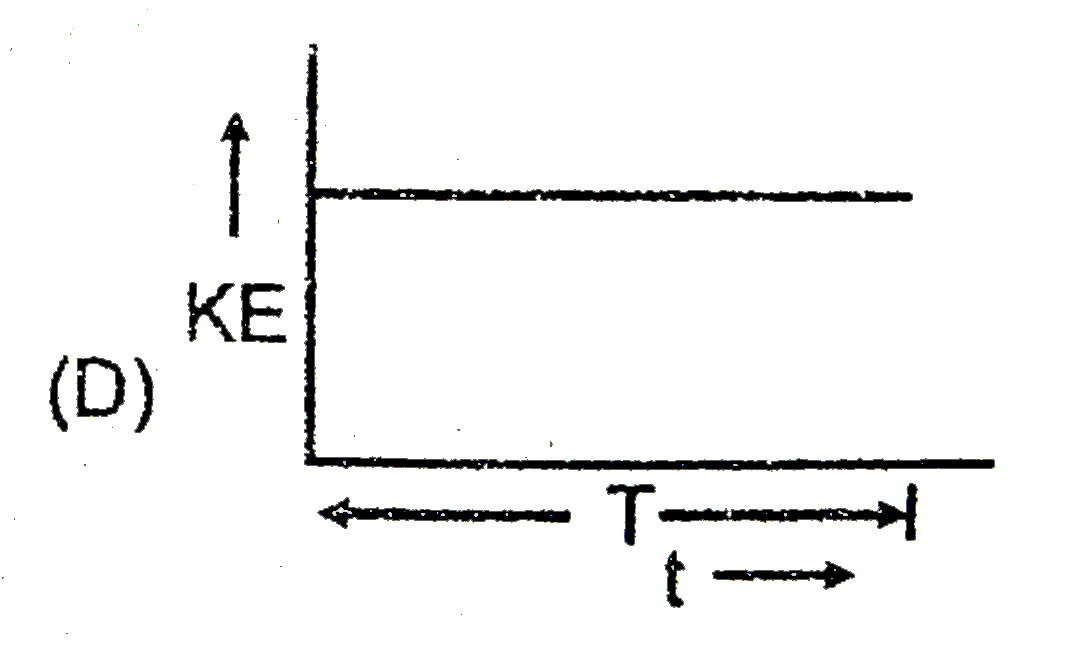
In S.H.M., the graph between kinetic energy K and time 't' is
A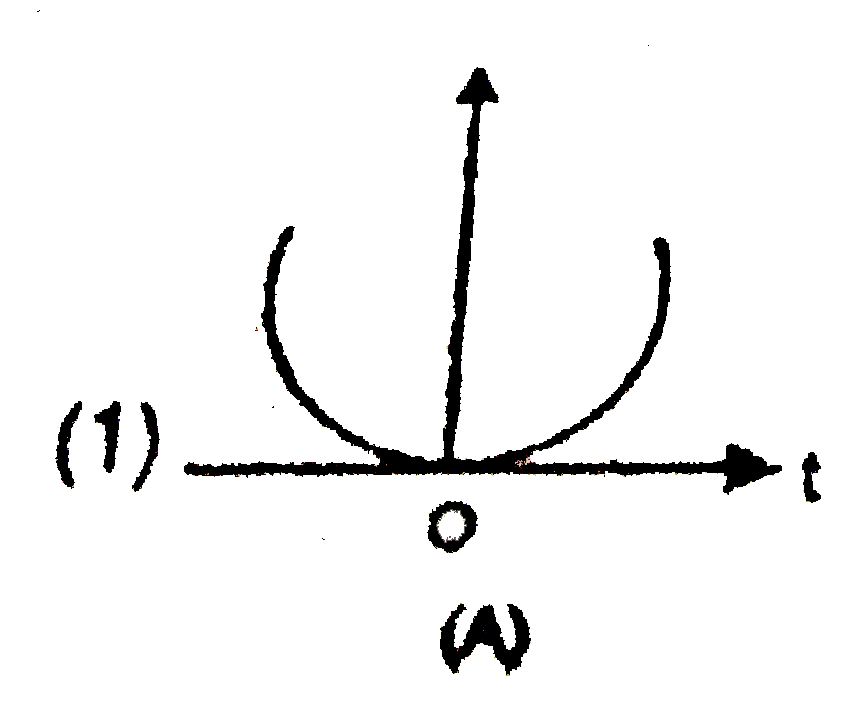 B
B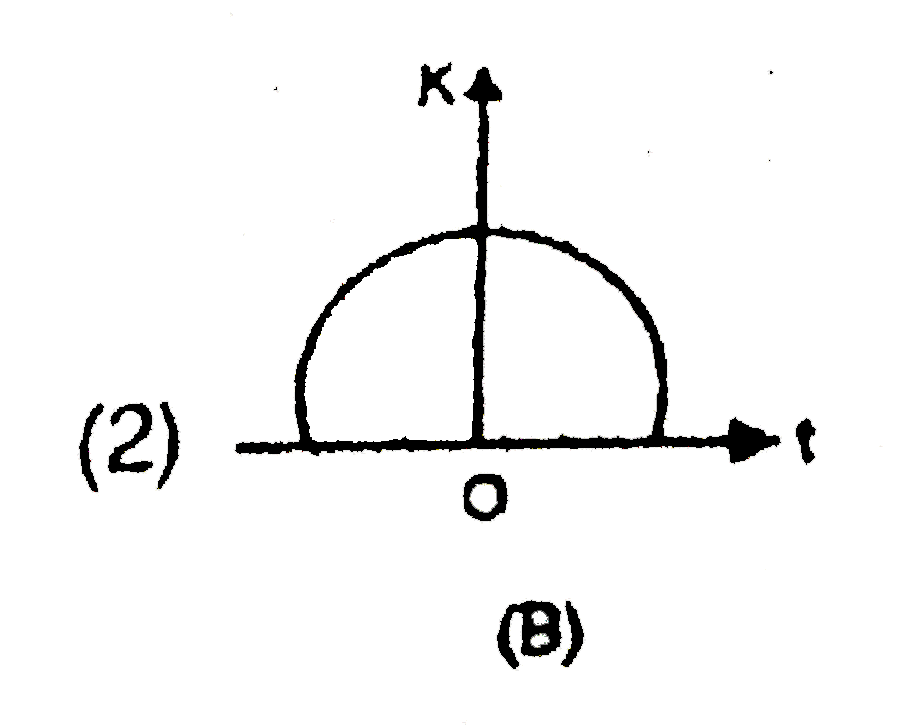 C
C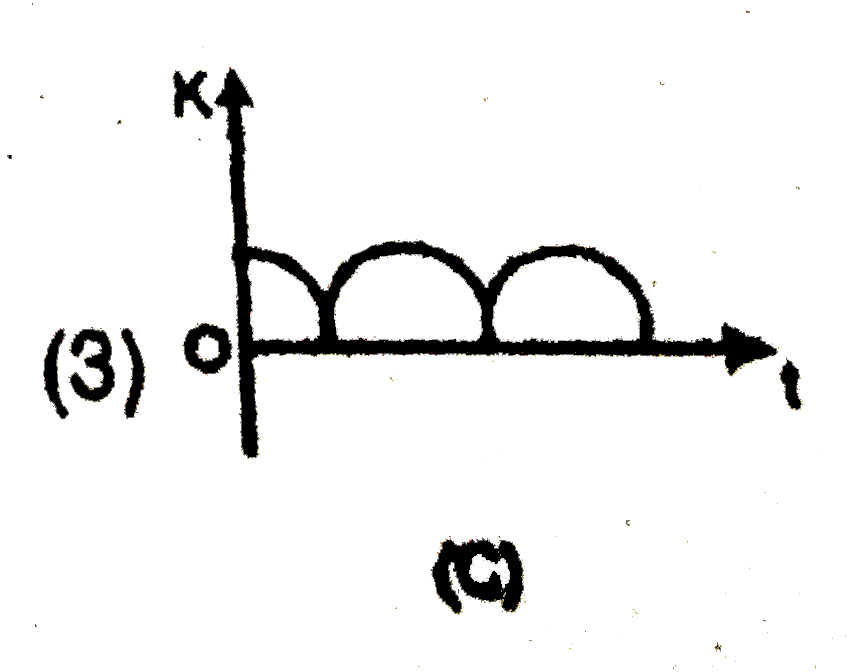 D
D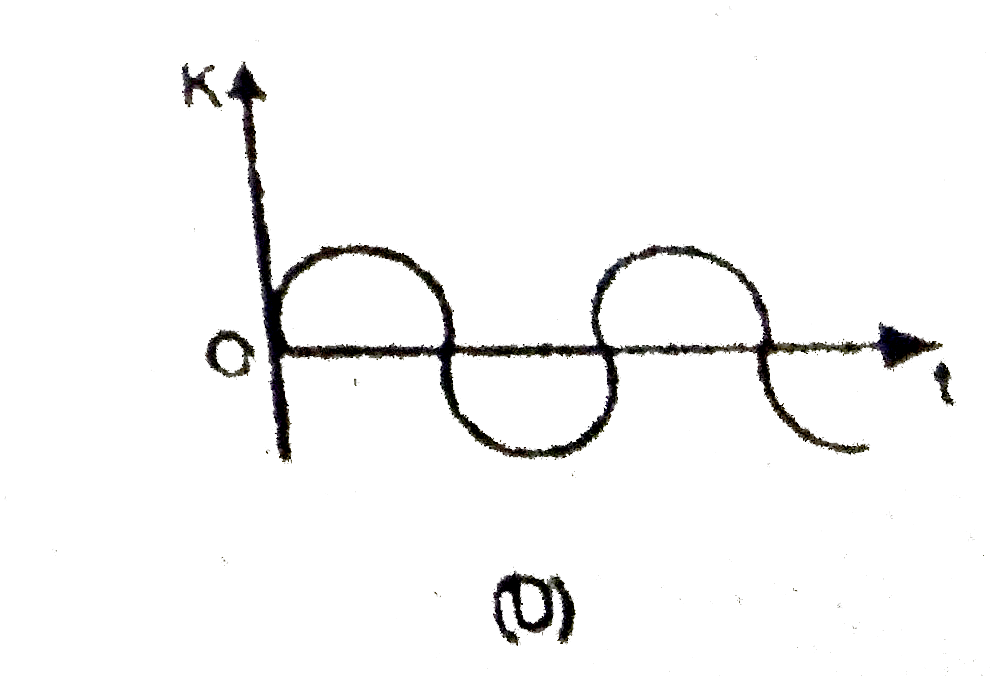
The graph between kinetic energy and displacement of a particle performing S.H.M. is
View SolutionAcceleration time graph of a body is shown below the corresponding velocity time graph of the same body is
View SolutionAcceleration time graph of a body is shown below the corresponding velocity time graph of the same body is

View SolutionIf a body is realeased from the top of a tower, the graph between distance (x) and time (t) is correctly shown by
View SolutionThe graph between L and T is correctly shown by
View Solution

