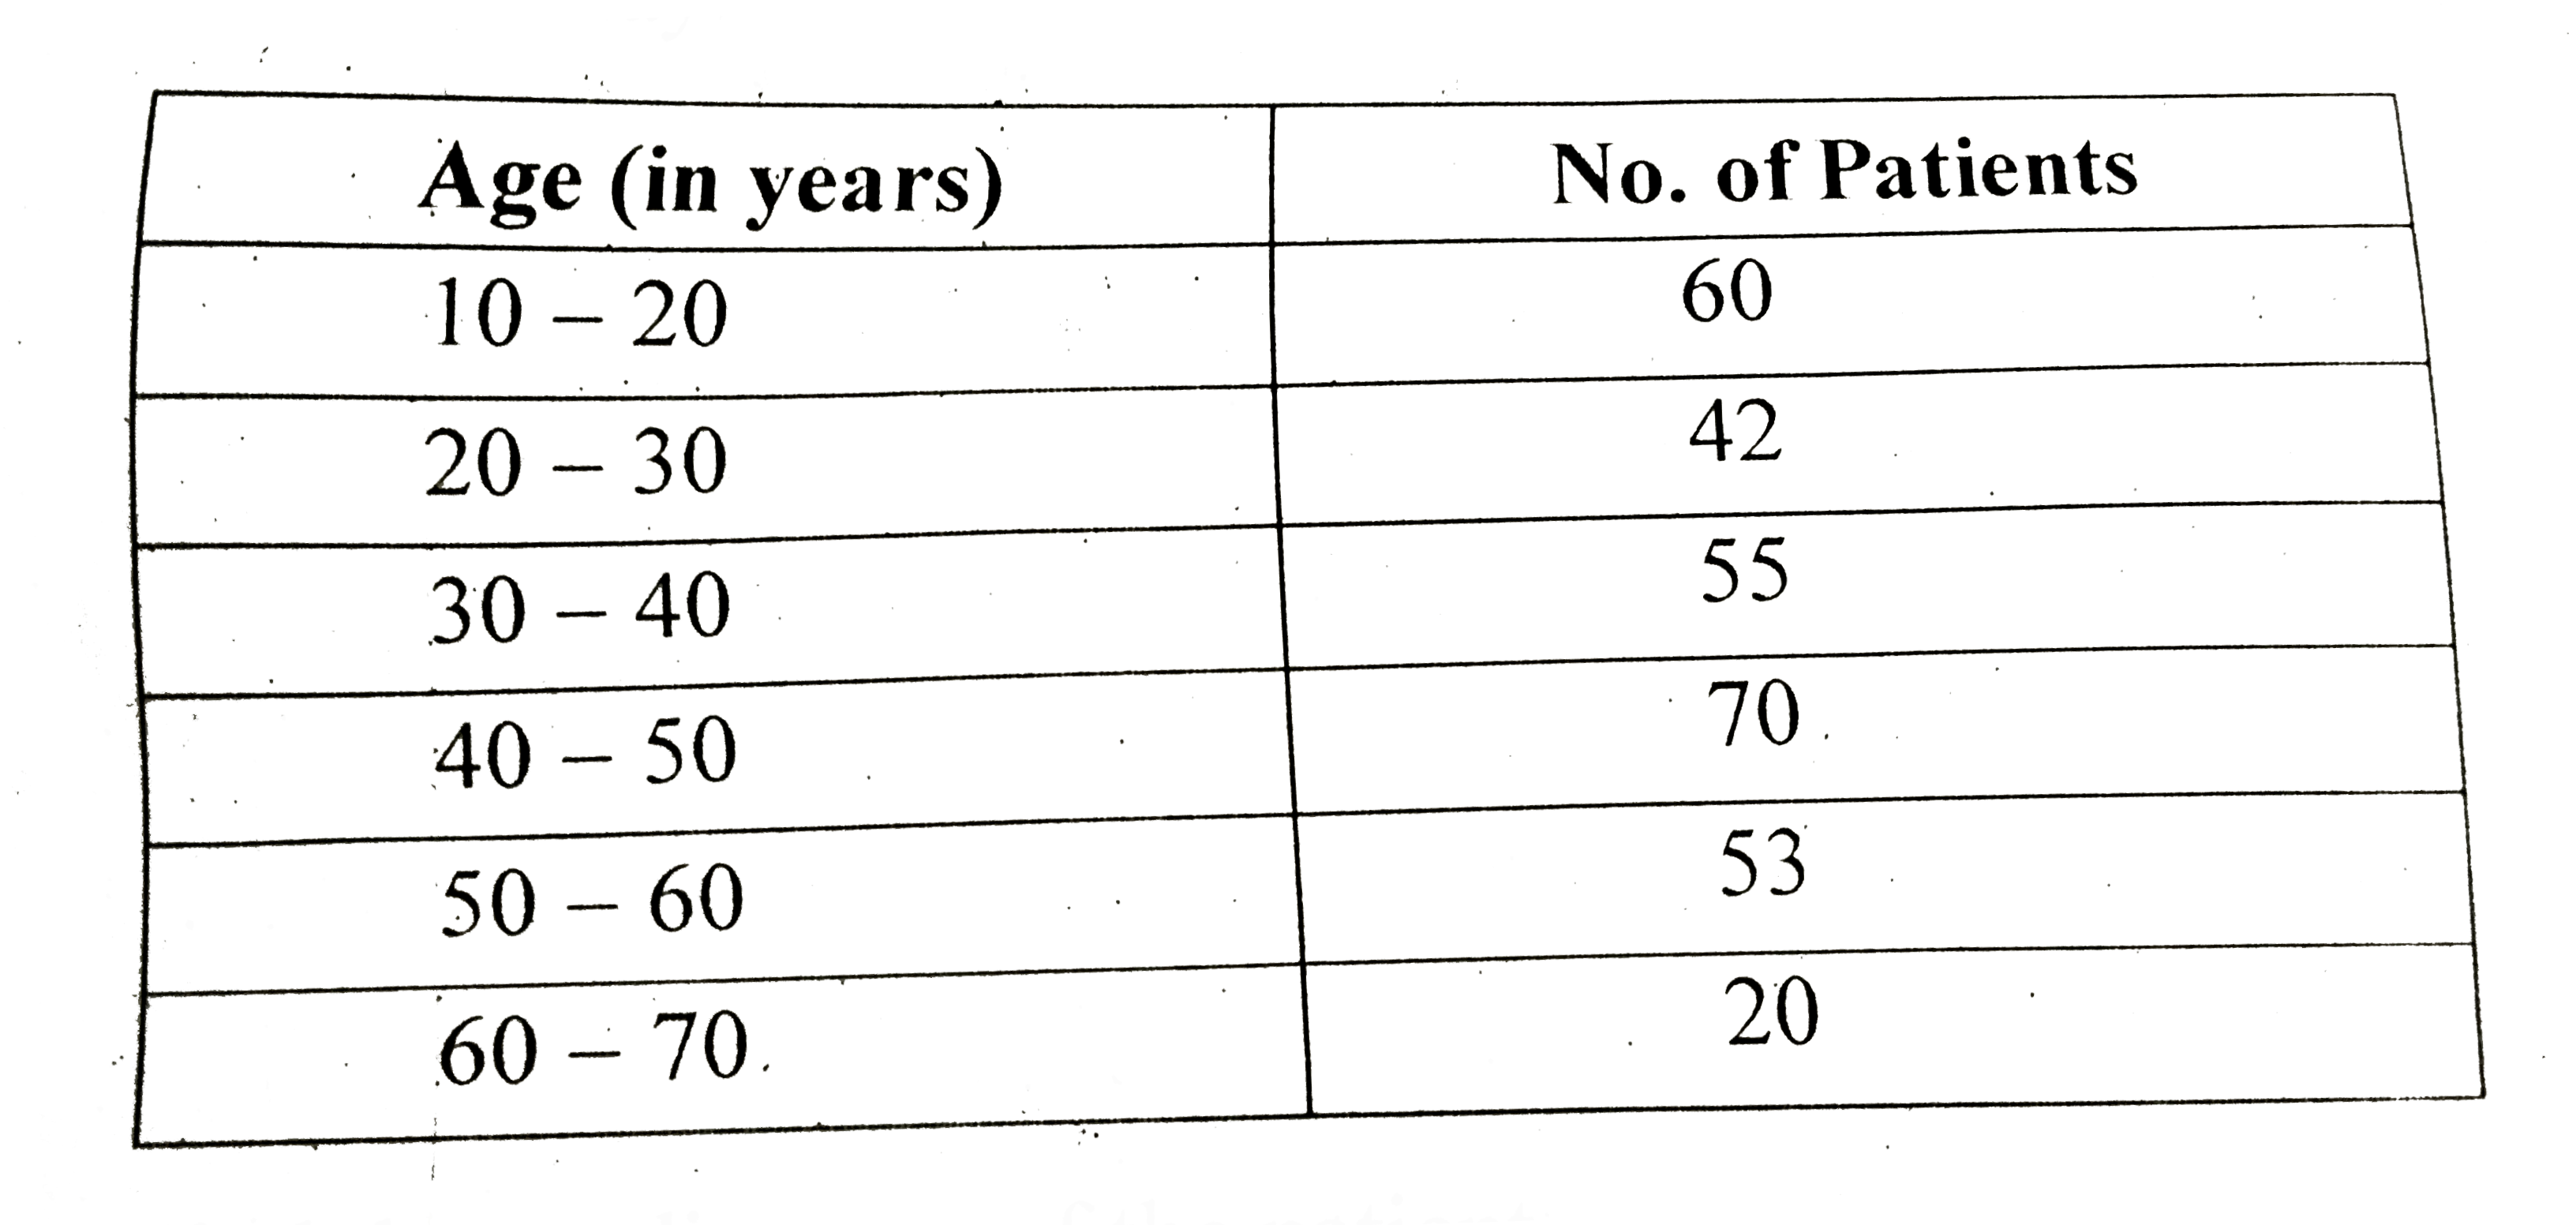
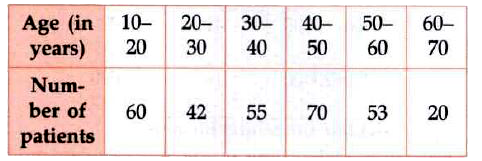
The following table shows the age of patients admitted in a hospital during a particular week:

Find the mean age of the patients.
Step by step video & image solution for The following table shows the age of patients admitted in a hospital during a particular week: Find the mean age of the patients. by Maths experts to help you in doubts & scoring excellent marks in Class 10 exams.
Updated on:21/07/2023Topper's Solved these Questions
- QUESTION PAPER 2022 TERM 2 SET 2 STANDARDBOOK - X BOARDSCHAPTER - QUESTION PAPER 2022 TERM 2 SET 2 STANDARDEXERCISE - SECTION C
7 Videos
- QUESTION PAPER 2022 TERM 2 SET 2 STANDARDBOOK - X BOARDSCHAPTER - QUESTION PAPER 2022 TERM 2 SET 2 STANDARDEXERCISE - SECTION C
7 Videos
- QUESTION PAPER 2022 TERM 2 SET 1 STANDARDBOOK - X BOARDSCHAPTER - QUESTION PAPER 2022 TERM 2 SET 1 STANDARDEXERCISE - QUESTION
18 Videos
- QUESTION PAPER 2022 TERM 2 SET 3 STANDARDBOOK - X BOARDSCHAPTER - QUESTION PAPER 2022 TERM 2 SET 3 STANDARDEXERCISE - SECTION C
7 Videos
Similar Questions
The following table shows the ages of the patients admitted in a hospital during a year:Find the mode and the mean of the data given above. Compare and interpret the two measures of central tendency.
View SolutionThe following table shows ages of 300 patients getting medical treatment in a hospital on a particular day:
Find the median age of the patient.
View SolutionThe following frequency distribution table gives the ages of 200 patients treated in a hospital in a week. Find the mode of ages of the patients.

View SolutionThe following frequency distribution table gives the ages of 200 patients treated in a hospital in a weak. Find the mode of ages of the patients.

View SolutionThe following frequency dsitribution table gives the ages of 80 patients treated in a hospital during a month. Find the mode of the ages of the patients.

View SolutionThe following frequency distribution table given the ages of 200 patients treated in a hospital in a week.Find the mode of ages of the pateints.

View SolutionThe following table shows the ages of persons who visited a museum on a certain day. Find the median age of the visitors.
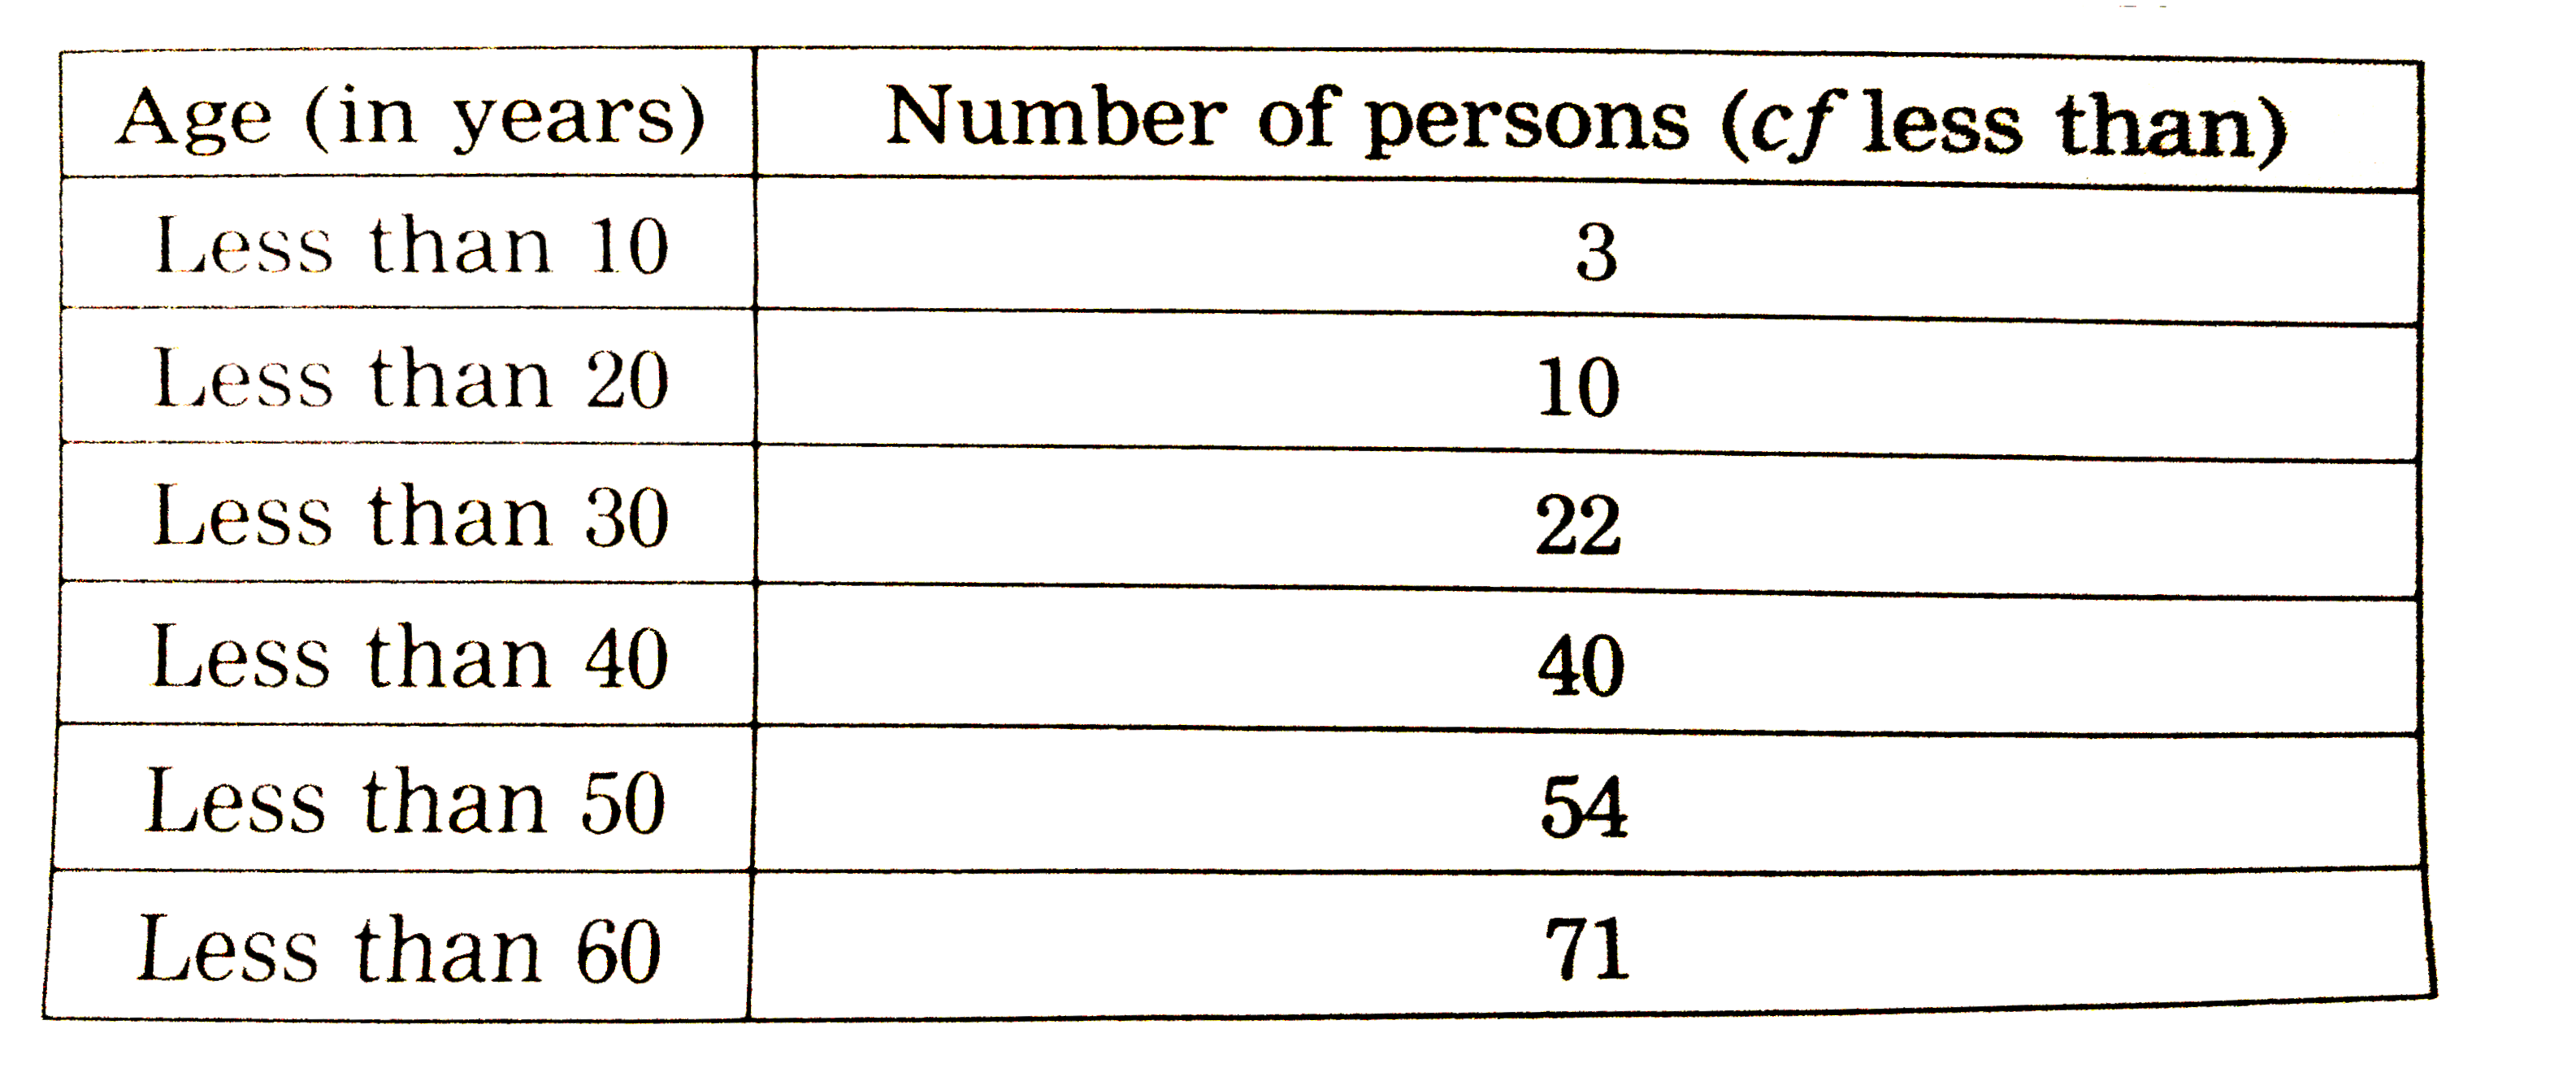
View SolutionThe following table shows the ages of persons who visited a museum on a certain day. Find the median age of the persons visitng the museum.
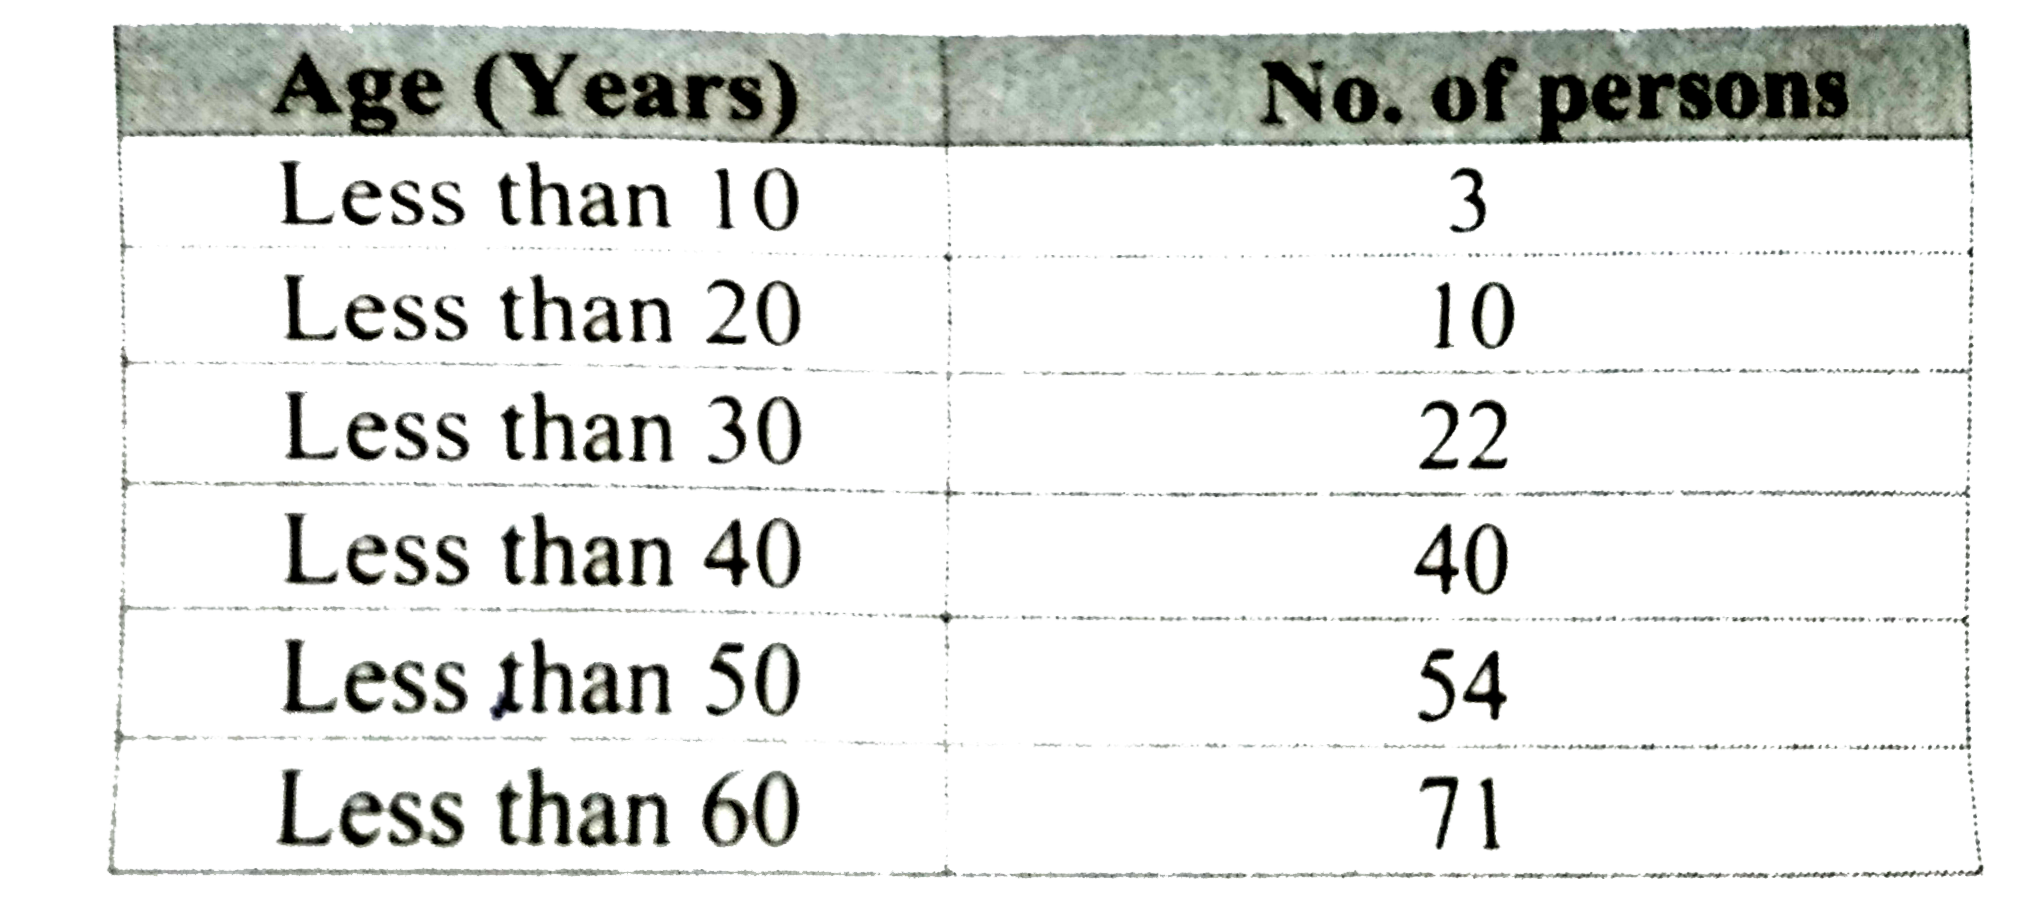
View SolutionThe following table shows the ages of persons who visited a museum on a certain day. Find the median age of the persons visitng the museum.
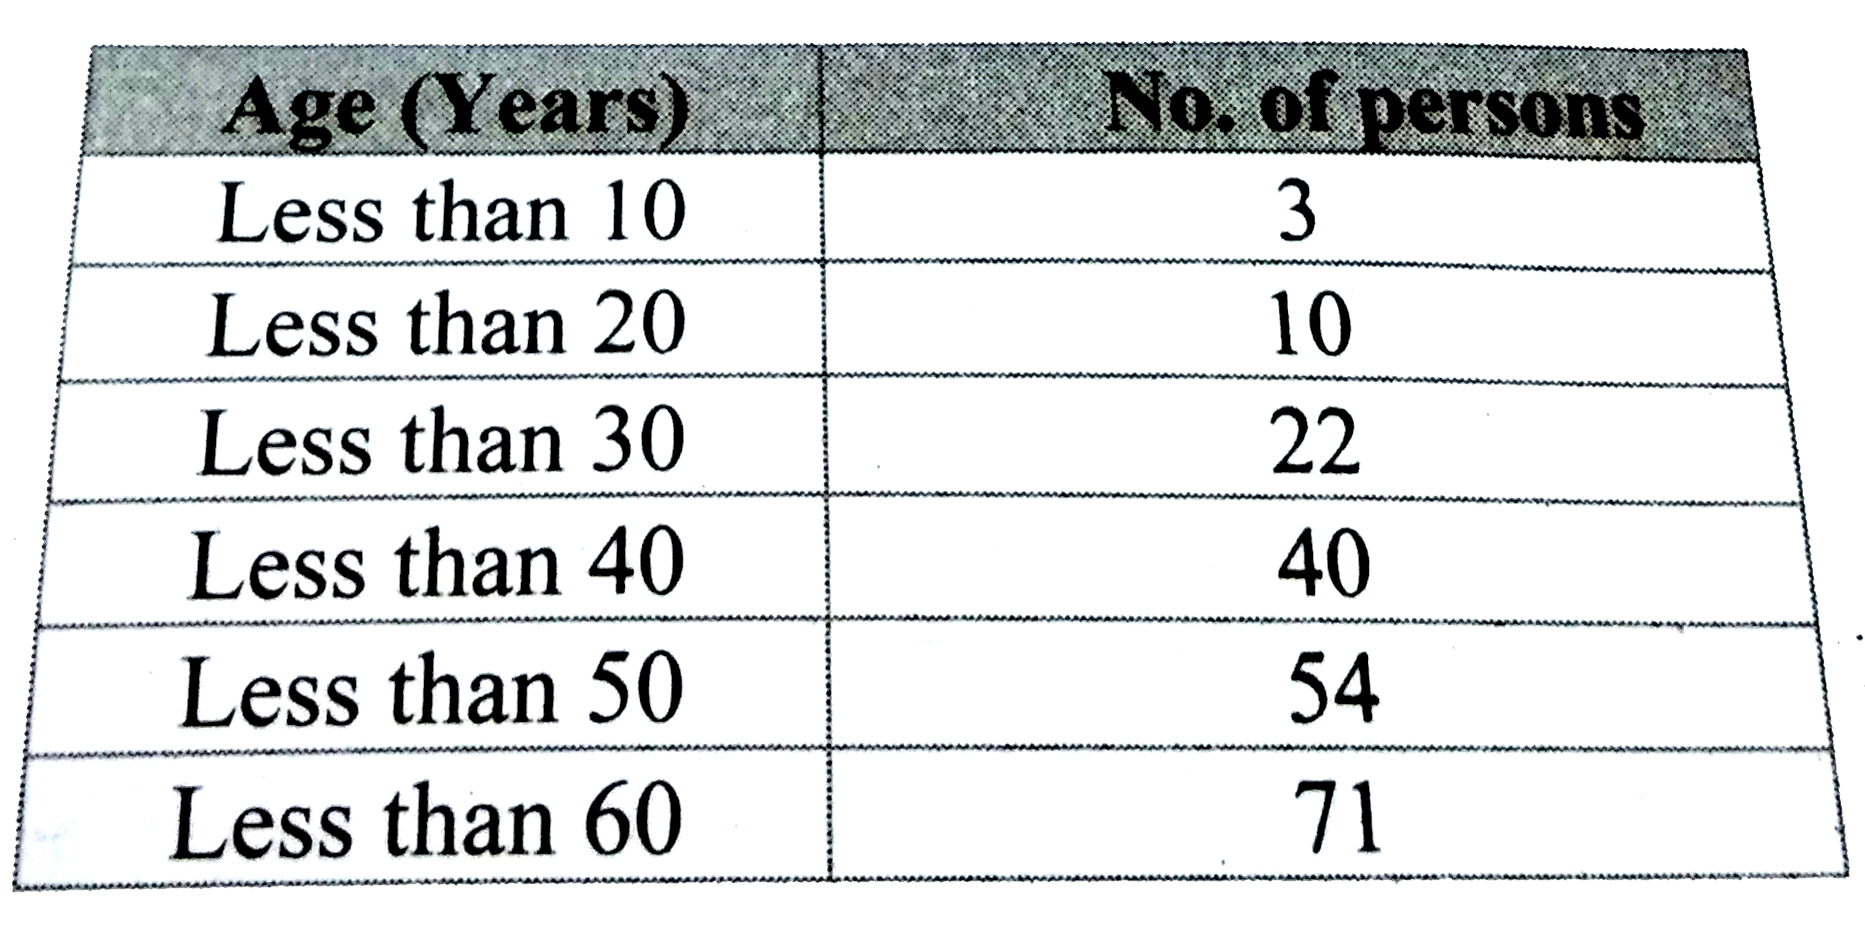
View SolutionThe following are the ages of 300 patients getting medical treatment in a hospital on a particular day:
Form
less than type cumulative frequency distribution.
View Solution
