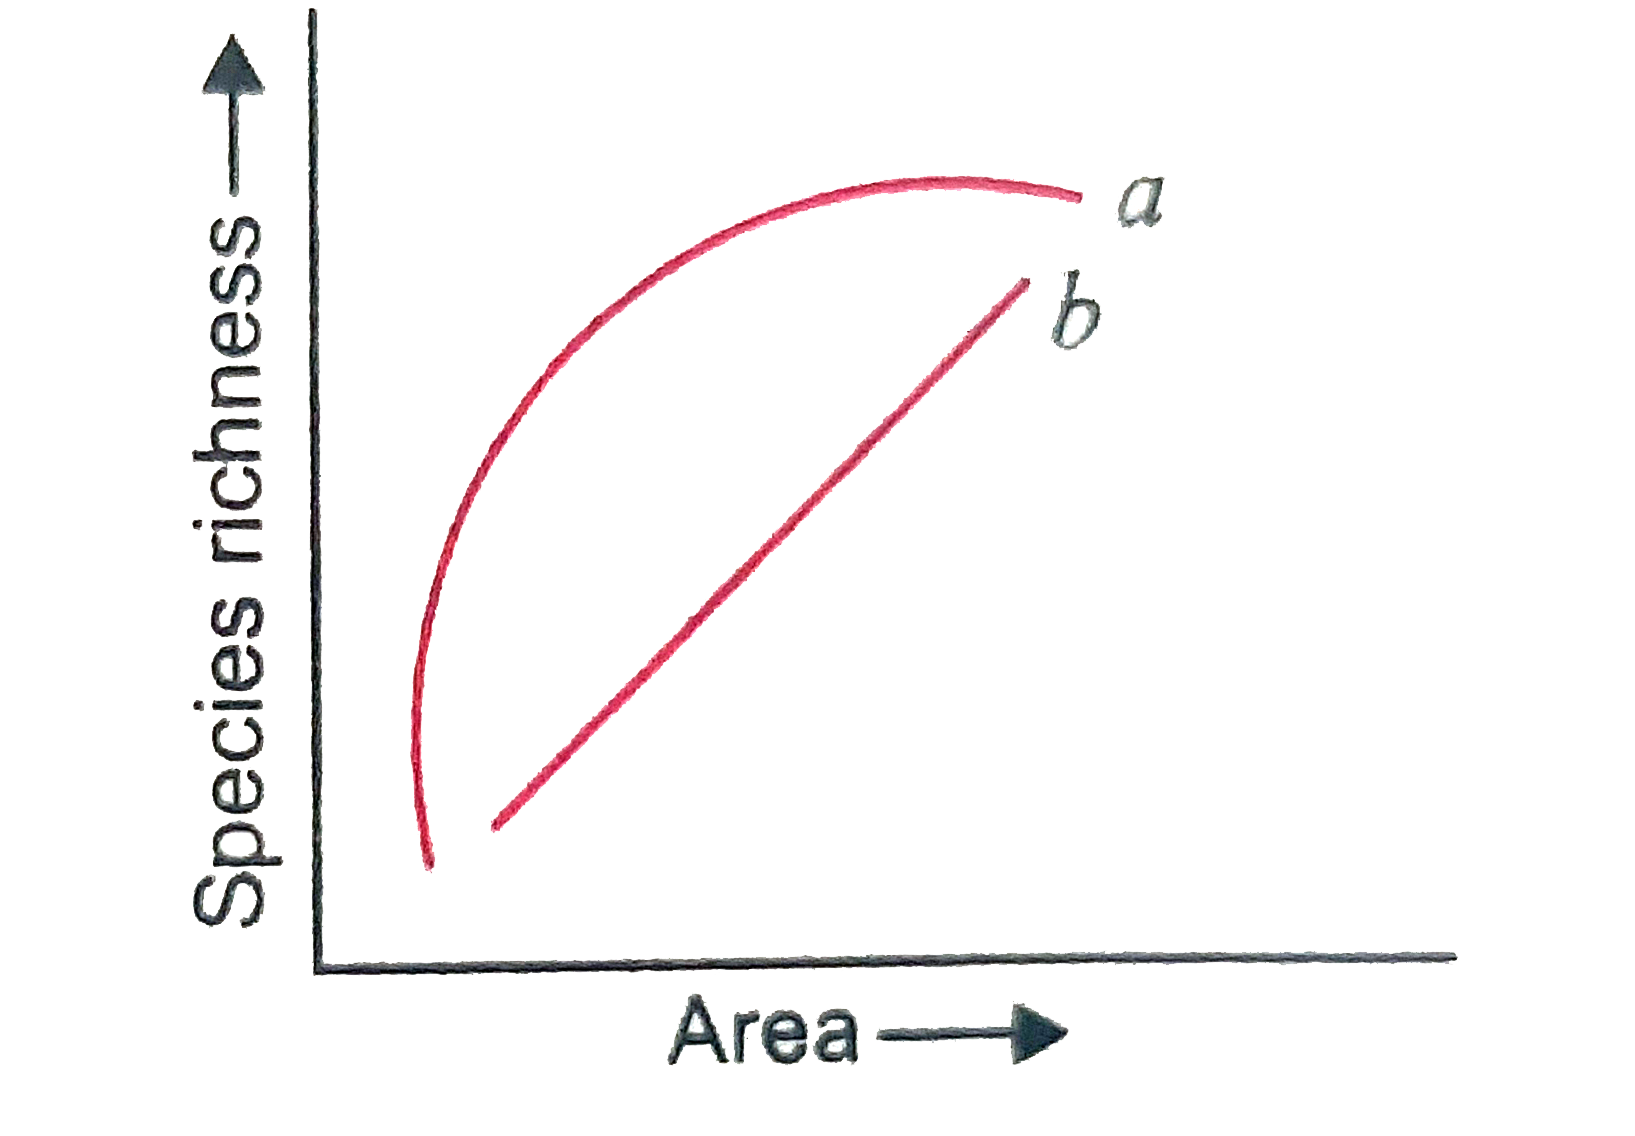
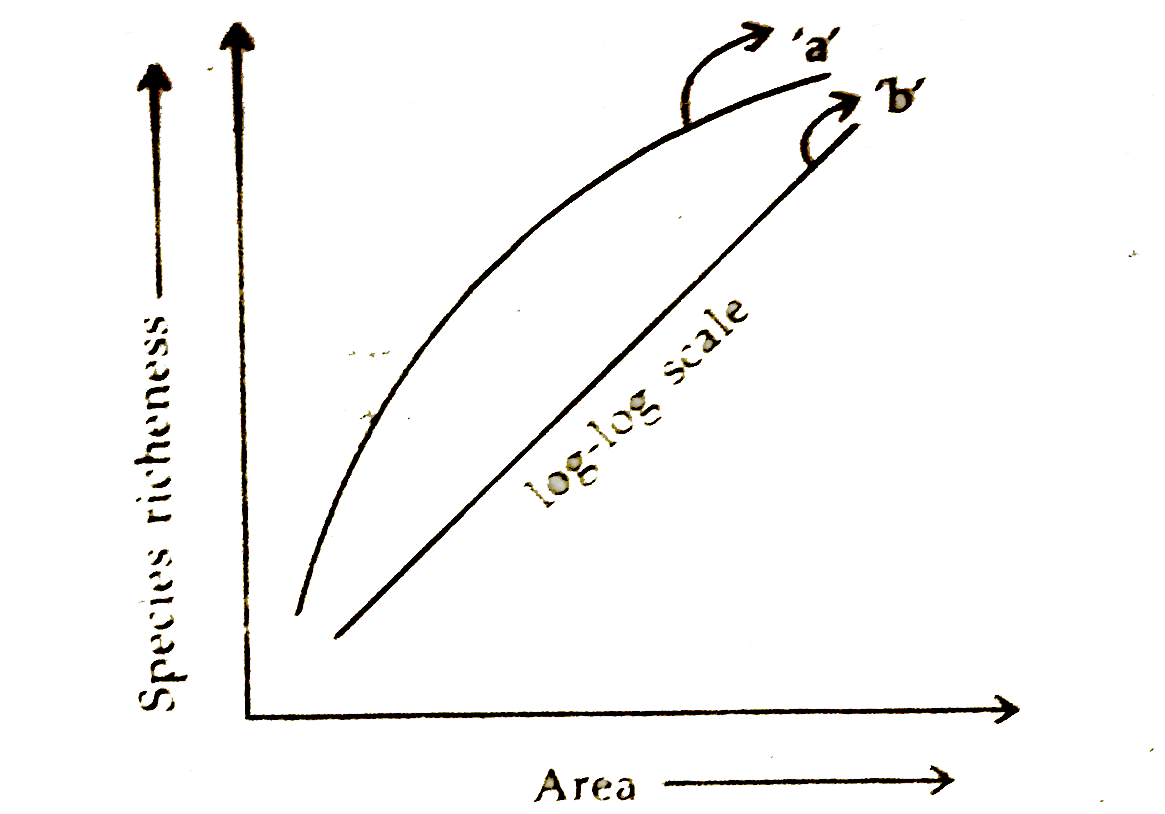
The graph given below shows species-area-relationship of a certain region
After a while, a small area was taken for constructing a road which divided the region into two. Write the impact this construction would have on species richness of the region.
Step by step video & image solution for The graph given below shows species-area-relationship of a certain region After a while, a small area was taken for constructing a road which divided the region into two. Write the impact this construction would have on species richness of the region. by Biology experts to help you in doubts & scoring excellent marks in Class 12 exams.
Updated on:21/07/2023Topper's Solved these Questions
- QUESTION PAPER 2022 SET-1BOOK - XII BOARDS PREVIOUS YEARCHAPTER - QUESTION PAPER 2022 SET-1EXERCISE - Section-C
5 Videos
- QUESTION PAPER 2022 SET-1BOOK - XII BOARDS PREVIOUS YEARCHAPTER - QUESTION PAPER 2022 SET-1EXERCISE - Section-C
5 Videos
- EXAM REVISION SERIESBOOK - XII BOARDS PREVIOUS YEARCHAPTER - EXAM REVISION SERIESEXERCISE - All Questions
32 Videos
- QUESTION PAPER 2022 SET-2BOOK - XII BOARDS PREVIOUS YEARCHAPTER - QUESTION PAPER 2022 SET-2EXERCISE - SECTION C
2 Videos
Similar Questions
Knowledge Check
Which of these protected areas is aimed towards the protection of only the animal species and habitats of a region?
ANational parkBWildlife sanctuaryCBiosphere reserveDBoth national parks and wildlife sanctuariesin the figure given below , if the areas of the regions are equal then which of the following is true ?
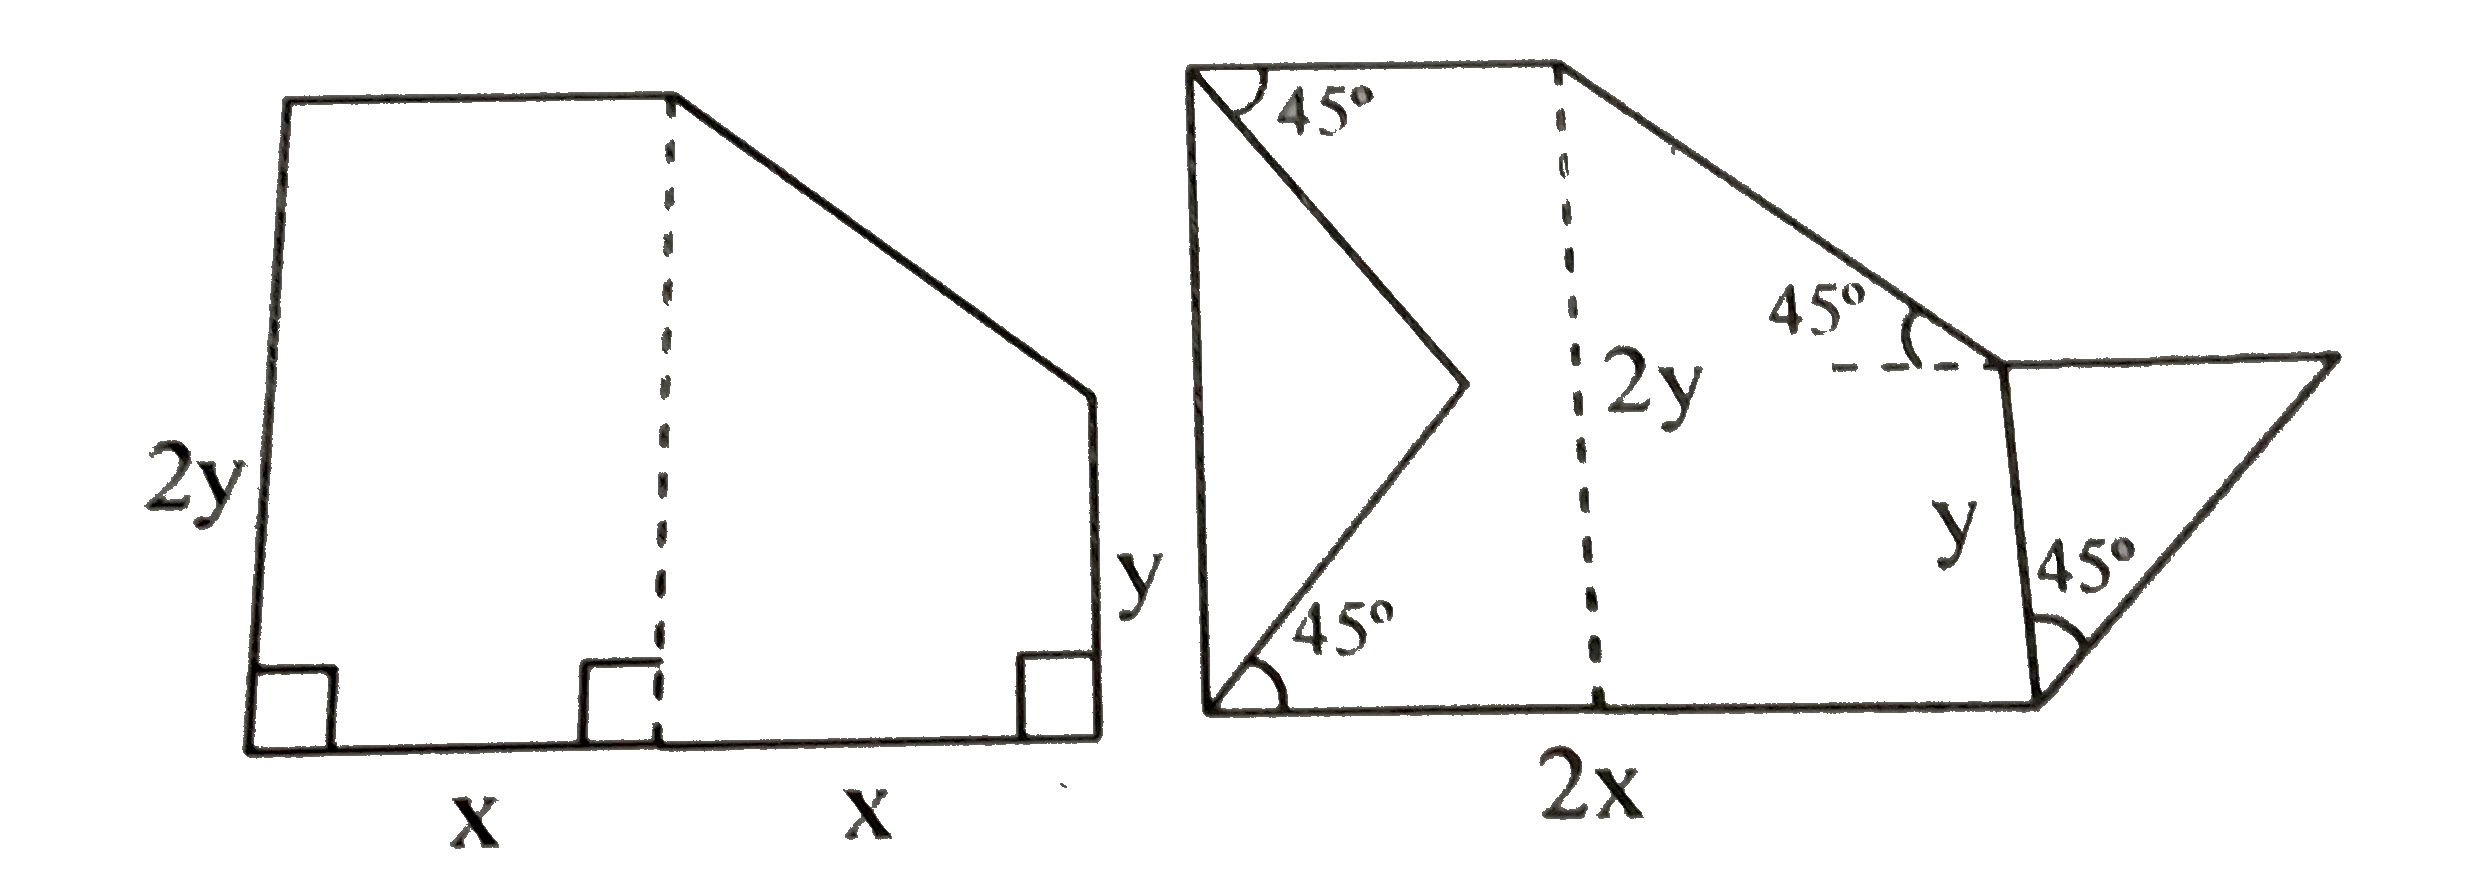 Ax=yBx=2yC2x=yDx=3y
Consider a region R={(x,y)∈R2:x2≤y≤2x}. If a line y=α divides the area of region R into two equal parts, then which of the following is true.?
Aα3−6α2+16=0B3α2−8α3/2+8=0Cα3−6α3/2−16D3α2−8α+8=0
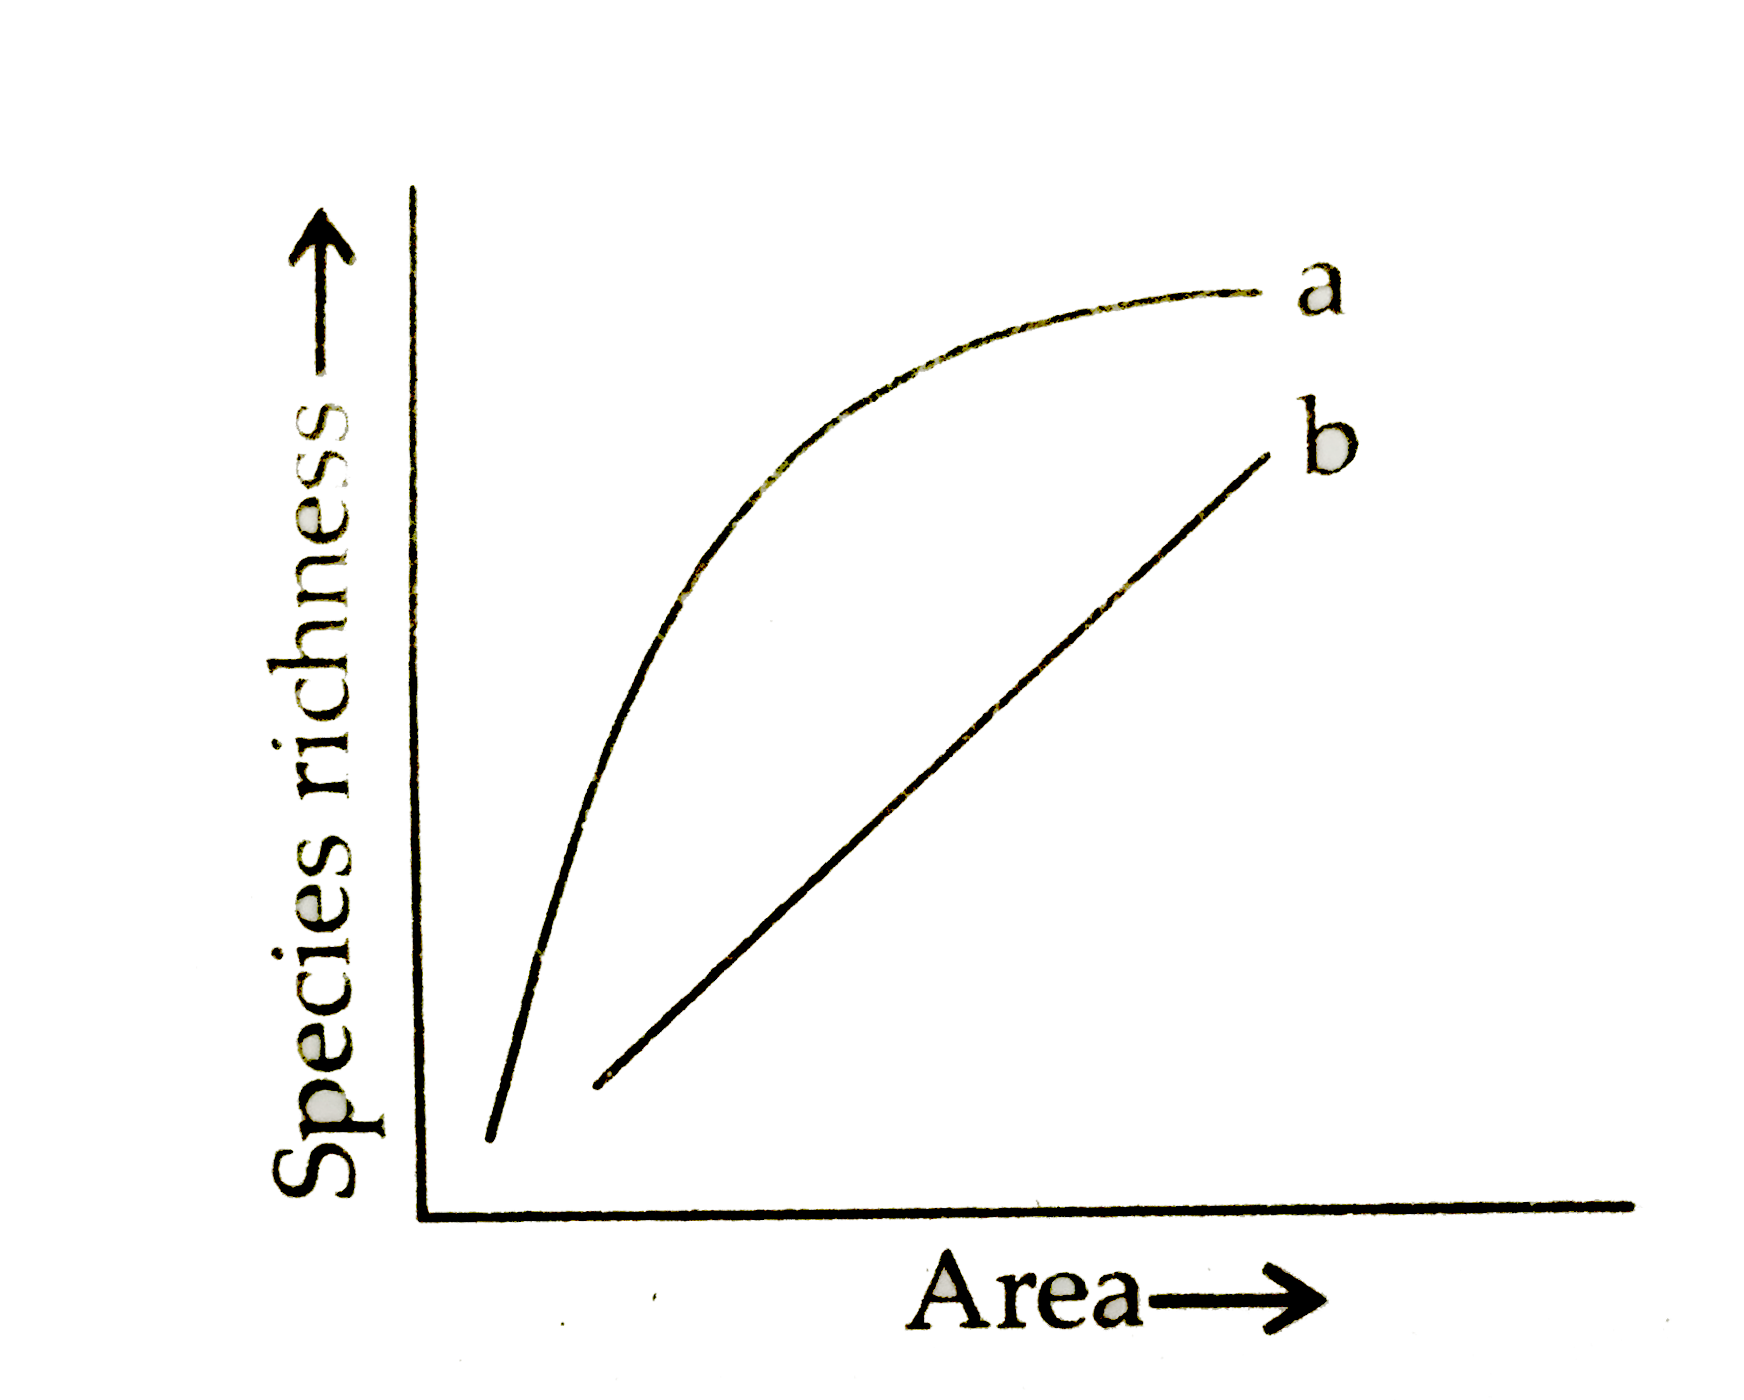
The following graph shows the species area relationship. Answers the Questions as directed.
(a) Name the naturalist who studied the kind of relationship shown in the graph.
Write the observations made by him.
(b) Write the situations as discovered by the ecologists when the value of 'Z' (slope of the line) lies between
(i) 0.1 and 0.2, (ii) 0.6 and 1.2
What does 'Z' stand for ?
(c ) When would the slope of the line 'b' become steeper ?
View SolutionFigures given below are of Darwin's finches ?

(a) Mention the specific geographical area where these were found.
(b) Name and explain the phenomenon that has resulted in the evolution of such diverse species in the region.
( c ) How did Darwin visit the particular geographical area ?
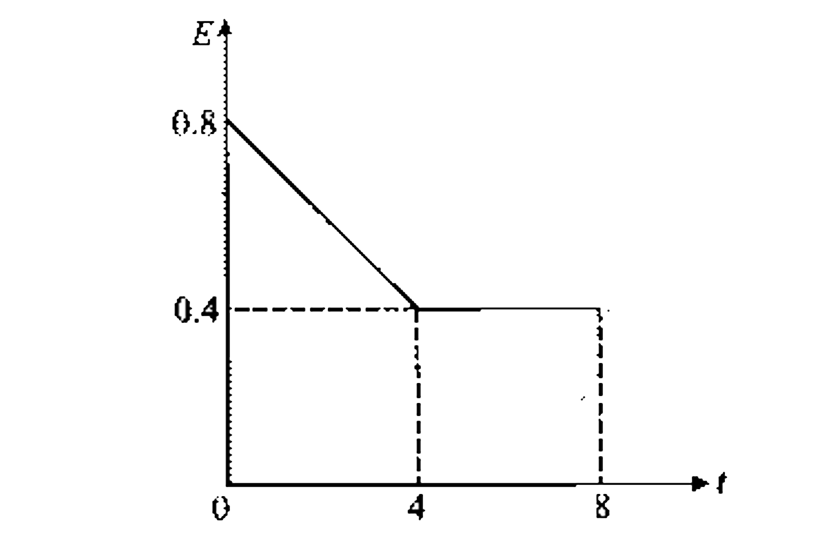
View SolutionThe graph given below shows the variation of electric field E (in MV/m) with time t (in μs) in a parallel plate capacitor
Consider the statements:
(1) The displacement current through a 1m2 region perpendicular to the during the time interval t=0 to t=4μs is 0.0885A (given ε0=8.85×10⁻¹² SI unit)
(2) The displacement current through 1m2 region perpendicular to the field during the time interval t=4μs to 8μs is zero.
Which of the statements given above is/are correct:
View SolutionWhich of these examples will have the steepest curve when log of species richness and log of area are plotted on a graph?
View SolutionOn a logarithmic scale, the species area relationship is a straight line described by the equation log S = log C + Z log A.
What does S, C, Z and A represent in the given equation? Select the correct answer from the codes given below.
Species richness=1Slope of the line=2Y-intercept=3Area=4
View Solution

