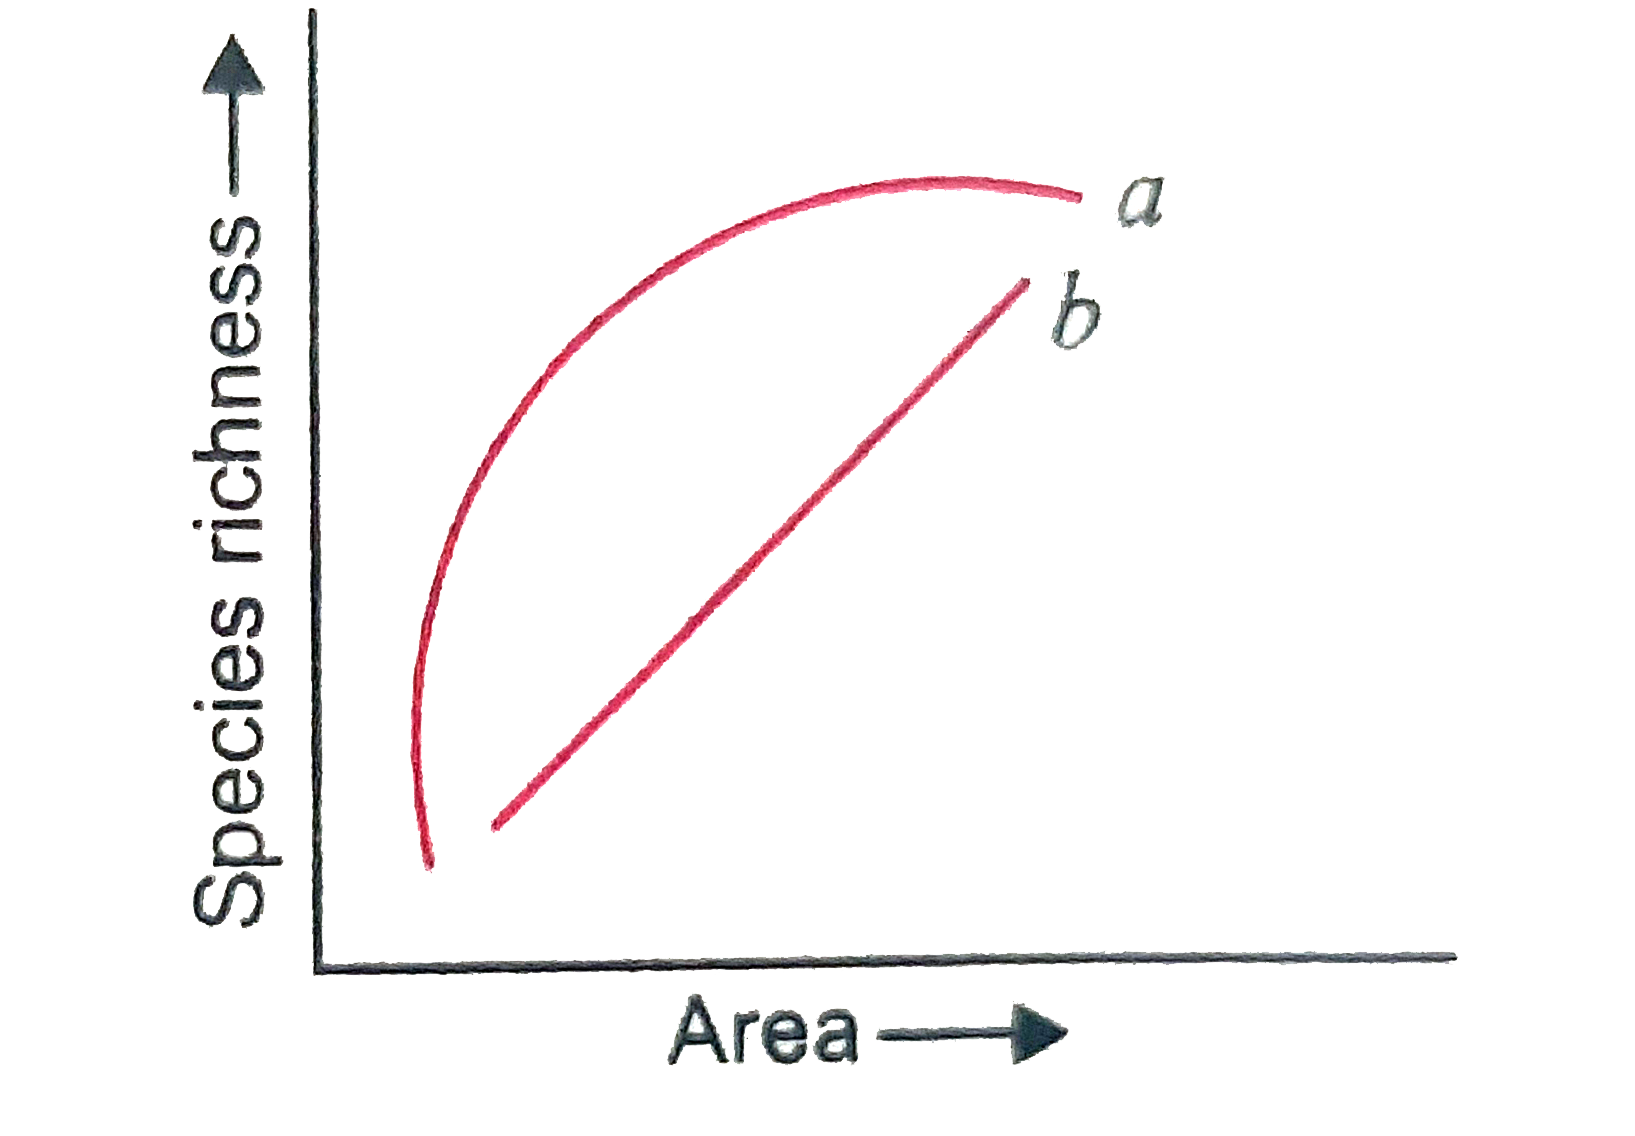
The graph given below shows species-area-relationship of a certain region
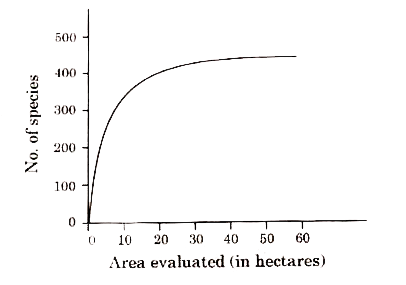
Study the graph and explain what it represents
Step by step video & image solution for The graph given below shows species-area-relationship of a certain region Study the graph and explain what it represents by Biology experts to help you in doubts & scoring excellent marks in Class 12 exams.
Topper's Solved these Questions
- BOOK - XII BOARDS PREVIOUS YEARCHAPTER - QUESTION PAPER 2022 SET-1EXERCISE - Section-C5videos
QUESTION PAPER 2022 SET-1
- BOOK - XII BOARDS PREVIOUS YEARCHAPTER - QUESTION PAPER 2022 SET-1EXERCISE - Section-C5videos
QUESTION PAPER 2022 SET-1
- BOOK - XII BOARDS PREVIOUS YEARCHAPTER - EXAM REVISION SERIESEXERCISE - All Questions32videos
EXAM REVISION SERIES
- BOOK - XII BOARDS PREVIOUS YEARCHAPTER - QUESTION PAPER 2022 SET-2EXERCISE - SECTION C2videos
QUESTION PAPER 2022 SET-2
Similar Questions
Knowledge Check
- Question 1 - Select One
Species area relationship was given by
AAlexander von HumboldtBPaulCMayerDBoth (a) and (b) - Question 2 - Select One
Species-Area relationship was given by
ABritish zoologist and geographer David TilmanBGerman botanist and geographer Alexander von HumboldtCGerman naturalist and geographer Alexander von HumboldtDBritish naturalist and geographer Alexander von Huboldt - Question 3 - Select One
Species area relationship was given by :-
ARobert constranzaBAlexander von humboldtCAlexander flemmingDStamford ecologist Paul Ehrlich
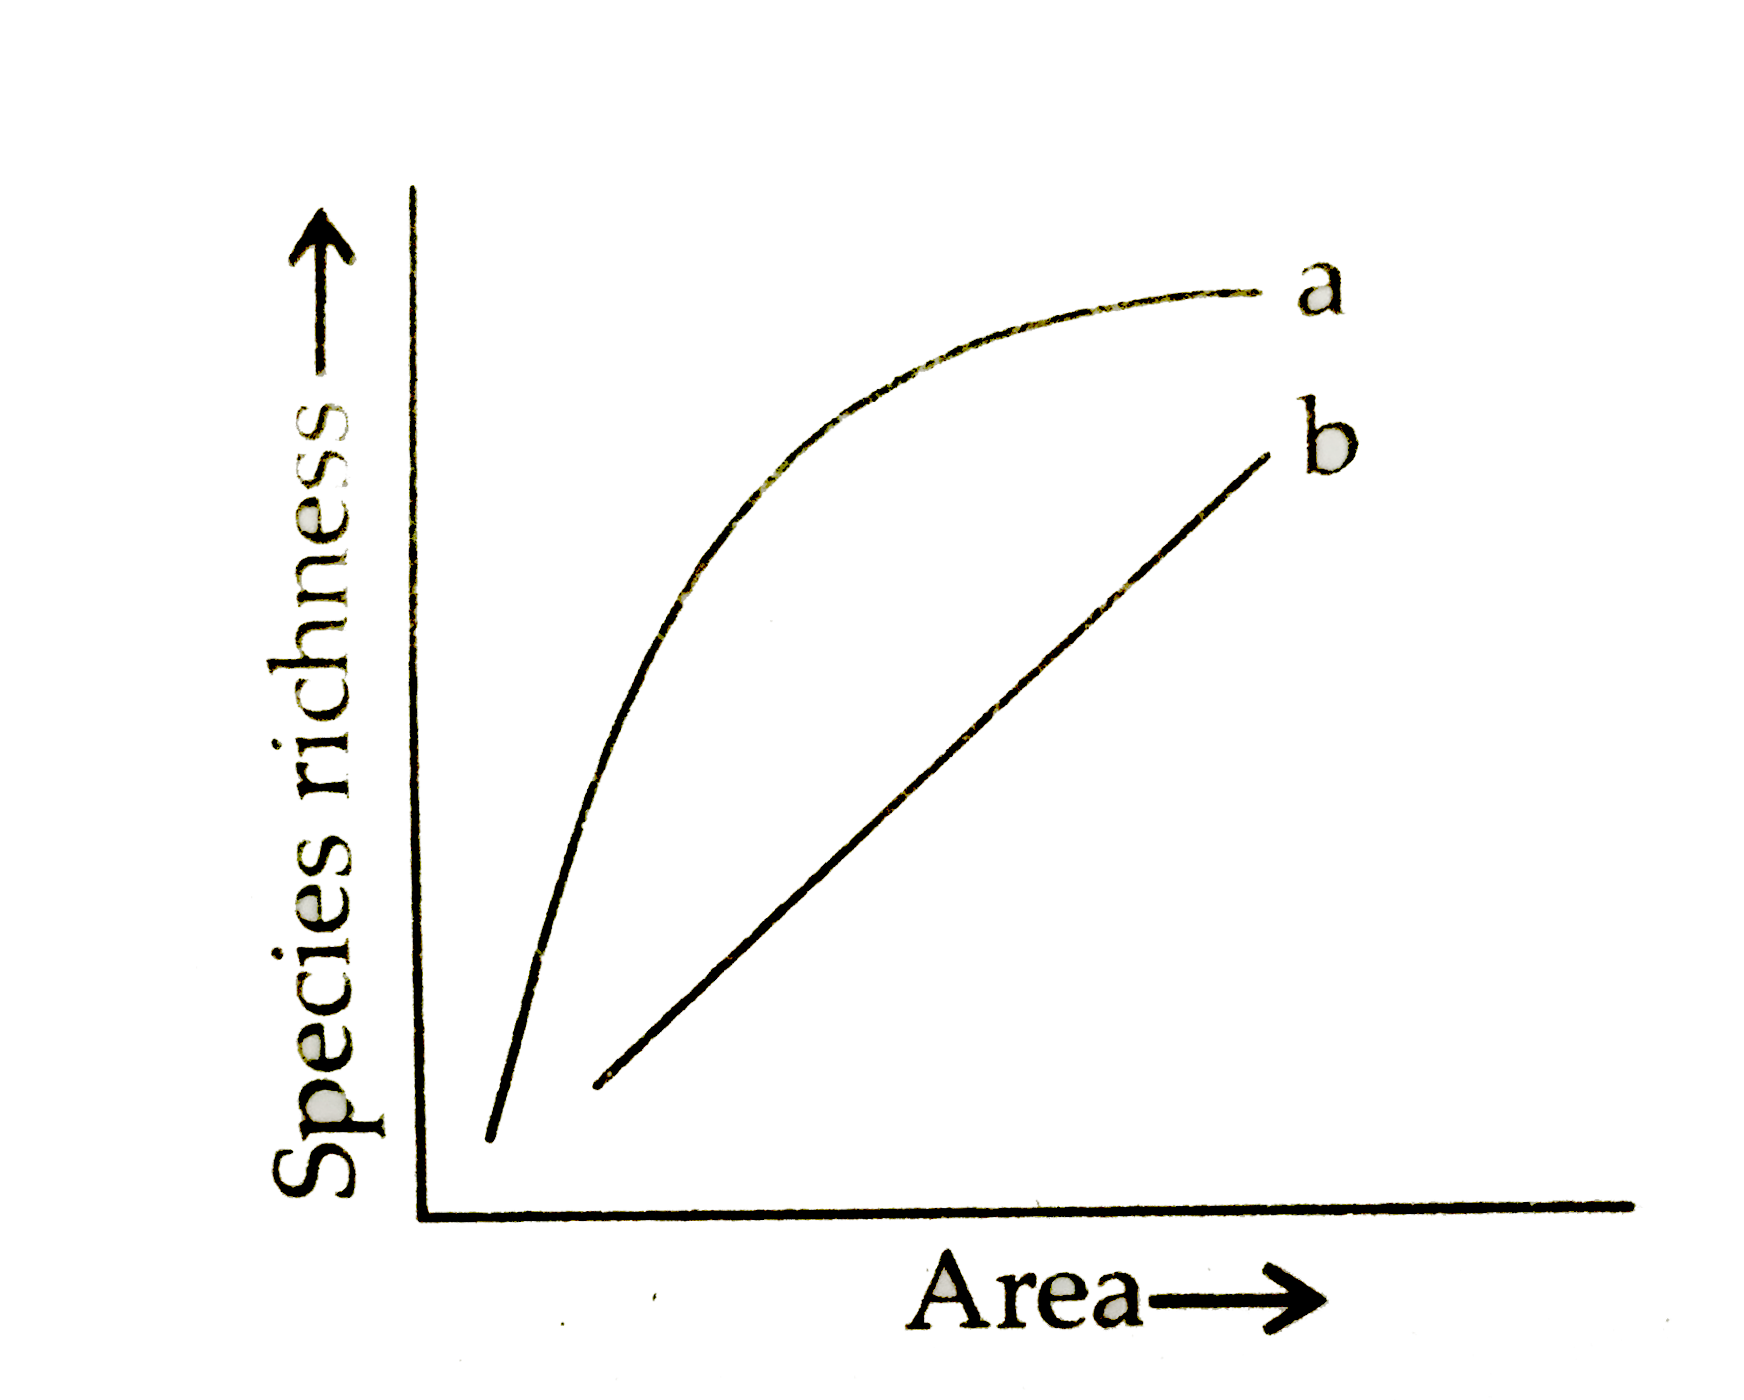
The above graph show Species-Area relationship. Write the equation of the curve a and explain.
 View Solution
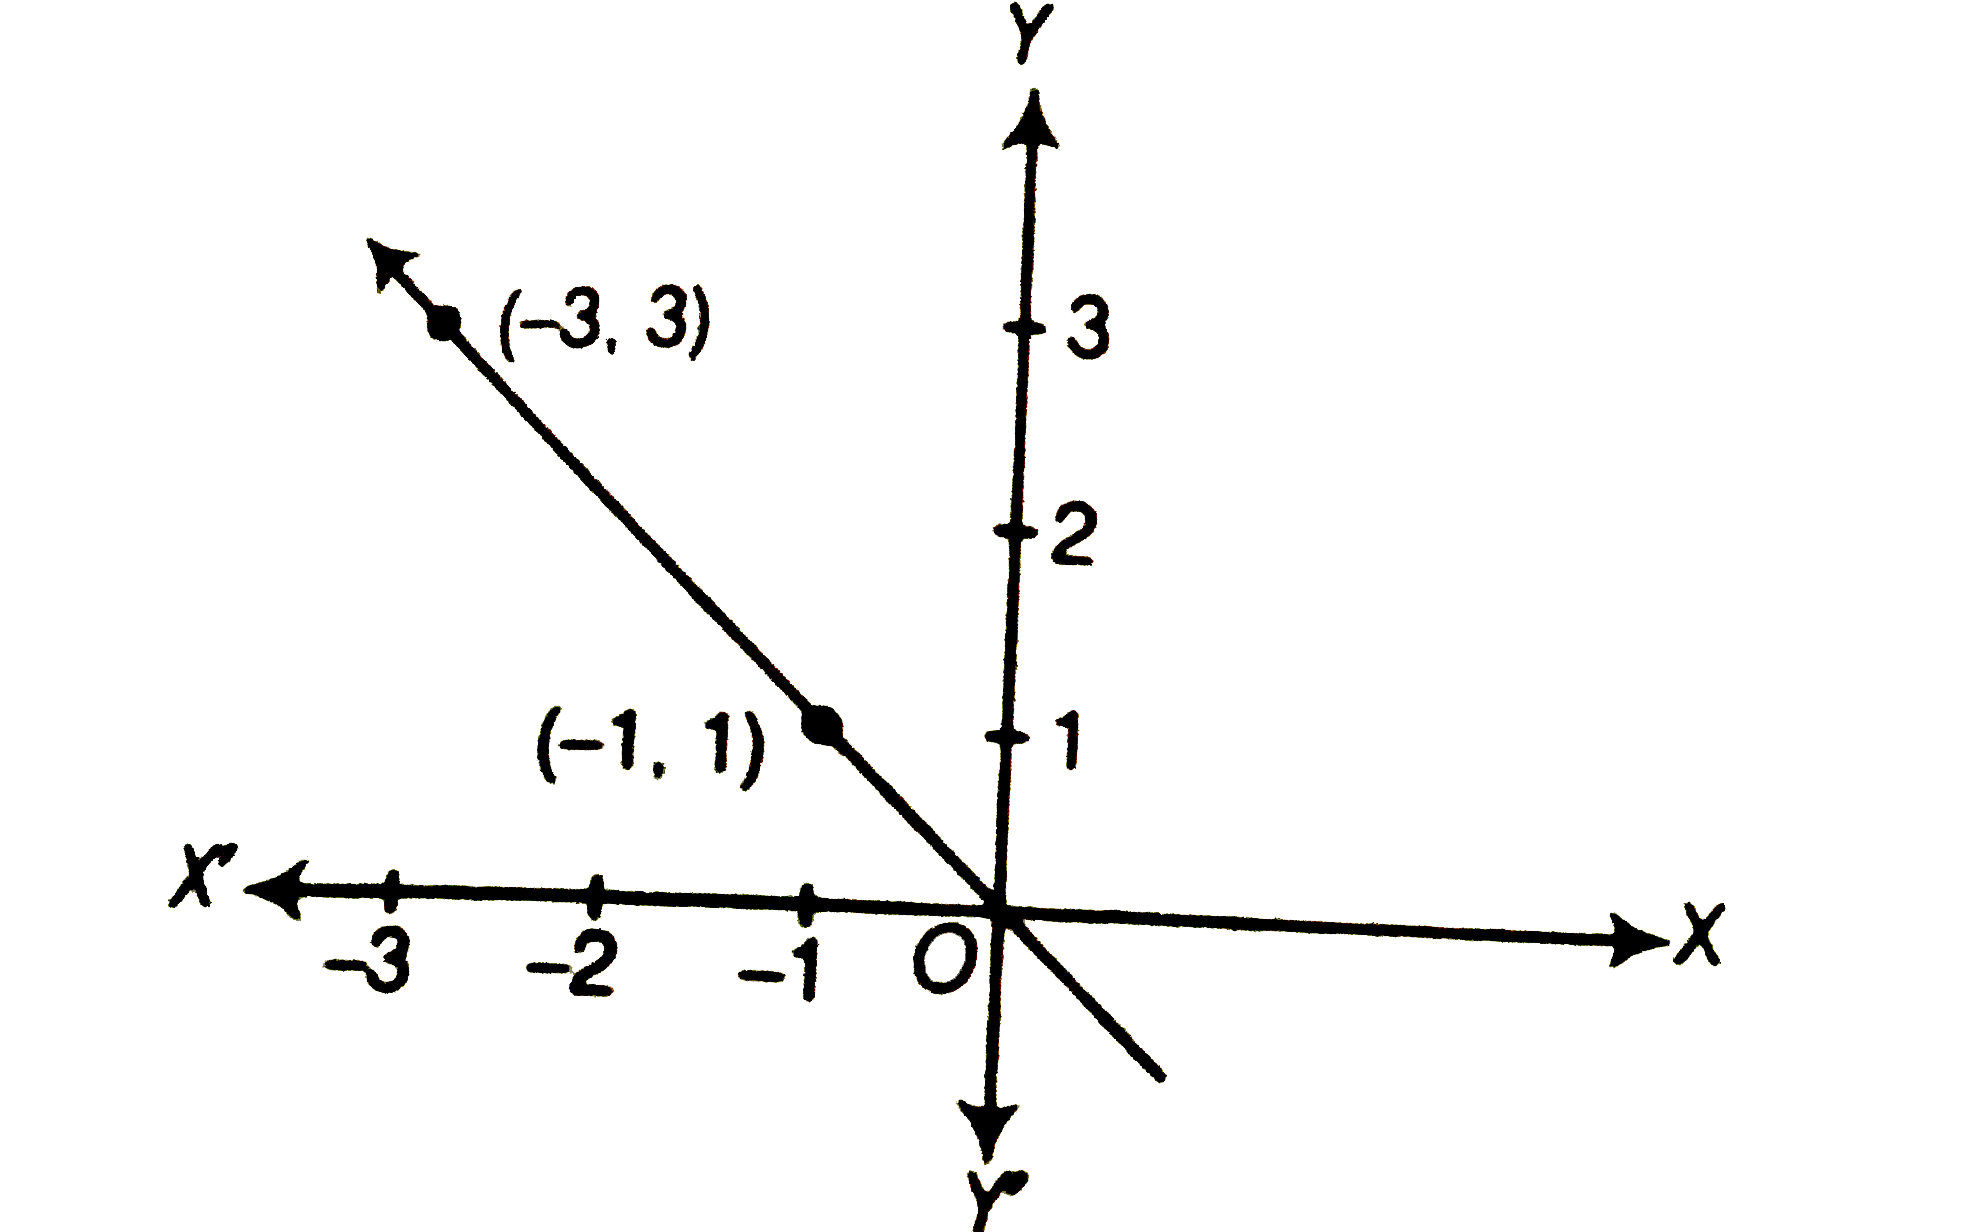
The graph given below represents the linear equation x+y=0.
 View Solution
The bar graph given below represents the circulation of newspapers in different languages in a town. Study the bar graph and answer the following questions:
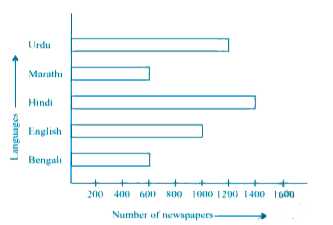
What is the circulation of English newspaper?View SolutionThe bar graph given below represents the circulation of newspapers in different languages in a town. Study the bar graph and answer the following questions:
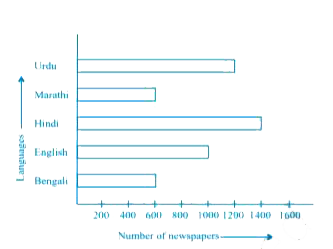
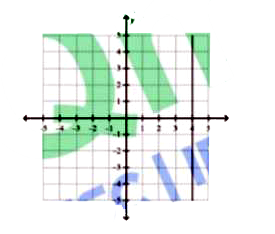
Name the two languages in which circulation of newspaper is the same.View SolutionThe equation of the graph given below is
 View Solution


