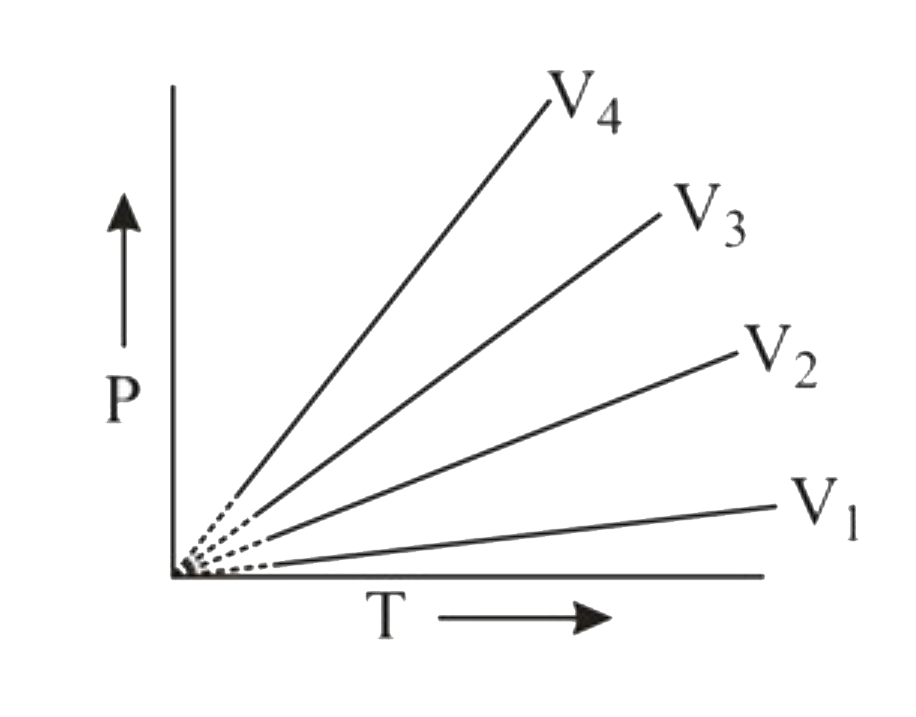
a graph between prssure P (along y-axis) and absolute temperature, T(along x-axis) for equal moles of two gases has been drawn . Given that volume of second gas is more than volume of first gas. Which of the following statement is correct?
Slope of gas 1 is less than gas 2
Slope of gas 1 is more than gas 2
Both have some slopes
None of the above
The correct Answer is:B
To solve the problem, we need to analyze the relationship between pressure (P), volume (V), and temperature (T) for two gases using the ideal gas law, which is given by the equation:
PV=nRT
Where:
- P = Pressure
- V = Volume
- n = Number of moles (constant for both gases)
- R = Universal gas constant (constant)
- T = Absolute temperature
1. Understanding the Ideal Gas Law:
Since the number of moles (n) and the universal gas constant (R) are constant for both gases, we can express the relationship between pressure and temperature as:
P=nRTV
This shows that pressure is inversely proportional to volume for a given temperature.
2. Rearranging the Equation:
We can rearrange the equation to express pressure per unit temperature:
PT=nRV
Here, PT represents the slope of the graph of pressure (P) versus temperature (T).
3. Identifying the Slopes:
From the equation PT=nRV, we can see that the slope of the graph for each gas is inversely proportional to its volume:
- For gas 1: slope1=nRV1
- For gas 2: slope2=nRV2
4. Comparing the Volumes:
According to the problem, the volume of the second gas (V2) is greater than the volume of the first gas (V1):
V2>V1
5. Analyzing the Slopes:
Since the slopes are inversely proportional to the volumes:
- If V2>V1, then slope2<slope1.
This means that the slope of the graph for gas 1 is greater than the slope for gas 2.
6. Conclusion:
Therefore, the correct statement is:
slope of gas 1 is more than that of gas 2
Final Answer:
The correct option is: B) Slope of gas 1 is more than that of gas 2.
- P = Pressure
- V = Volume
- n = Number of moles (constant for both gases)
- R = Universal gas constant (constant)
- T = Absolute temperature
Since the number of moles (n) and the universal gas constant (R) are constant for both gases, we can express the relationship between pressure and temperature as:
P=nRTV
This shows that pressure is inversely proportional to volume for a given temperature.
We can rearrange the equation to express pressure per unit temperature:
PT=nRV
Here, PT represents the slope of the graph of pressure (P) versus temperature (T).
From the equation PT=nRV, we can see that the slope of the graph for each gas is inversely proportional to its volume:
- For gas 1: slope1=nRV1
- For gas 2: slope2=nRV2
According to the problem, the volume of the second gas (V2) is greater than the volume of the first gas (V1):
V2>V1
Since the slopes are inversely proportional to the volumes:
- If V2>V1, then slope2<slope1.
This means that the slope of the graph for gas 1 is greater than the slope for gas 2.
Therefore, the correct statement is:
slope of gas 1 is more than that of gas 2
The correct option is: B) Slope of gas 1 is more than that of gas 2.
Topper's Solved these Questions
- SOLVD PAPERS 2017 NEET, AIIMS & JIPMERBOOK - DC PANDEY ENGLISHCHAPTER - SOLVD PAPERS 2017 NEET, AIIMS & JIPMEREXERCISE - Solved paper 2018(NEET)
22 Videos
- SOLVD PAPERS 2017 NEET, AIIMS & JIPMERBOOK - DC PANDEY ENGLISHCHAPTER - SOLVD PAPERS 2017 NEET, AIIMS & JIPMEREXERCISE - Solved paper 2018(AIIMS)
28 Videos
- SOLVD PAPERS 2017 NEET, AIIMS & JIPMERBOOK - DC PANDEY ENGLISHCHAPTER - SOLVD PAPERS 2017 NEET, AIIMS & JIPMEREXERCISE - Solved Papers 2017(AIIMS)
26 Videos
- SIMPLE HARMONIC MOTIONBOOK - DC PANDEY ENGLISHCHAPTER - SIMPLE HARMONIC MOTIONEXERCISE - Integer type questions
14 Videos
- SOUND WAVESBOOK - DC PANDEY ENGLISHCHAPTER - SOUND WAVESEXERCISE - Exercise 19.7
4 Videos
Similar Questions
A graph is plotted by taking pressure along y-axis and centigrade temperature along X-axis for an ideal gas at constant volume. x intercept of the graph is
View SolutionThe ideal gas equation for 1 mol of ideal gas is PV = nRT
graph between P and T at constant volume, i.e. isochores are plotted as under

Which of the following order of volume is correct ?
View SolutionA graph is plotted with PV/T on y-axis and mass of the gas along x-axis for different gases. The graph is
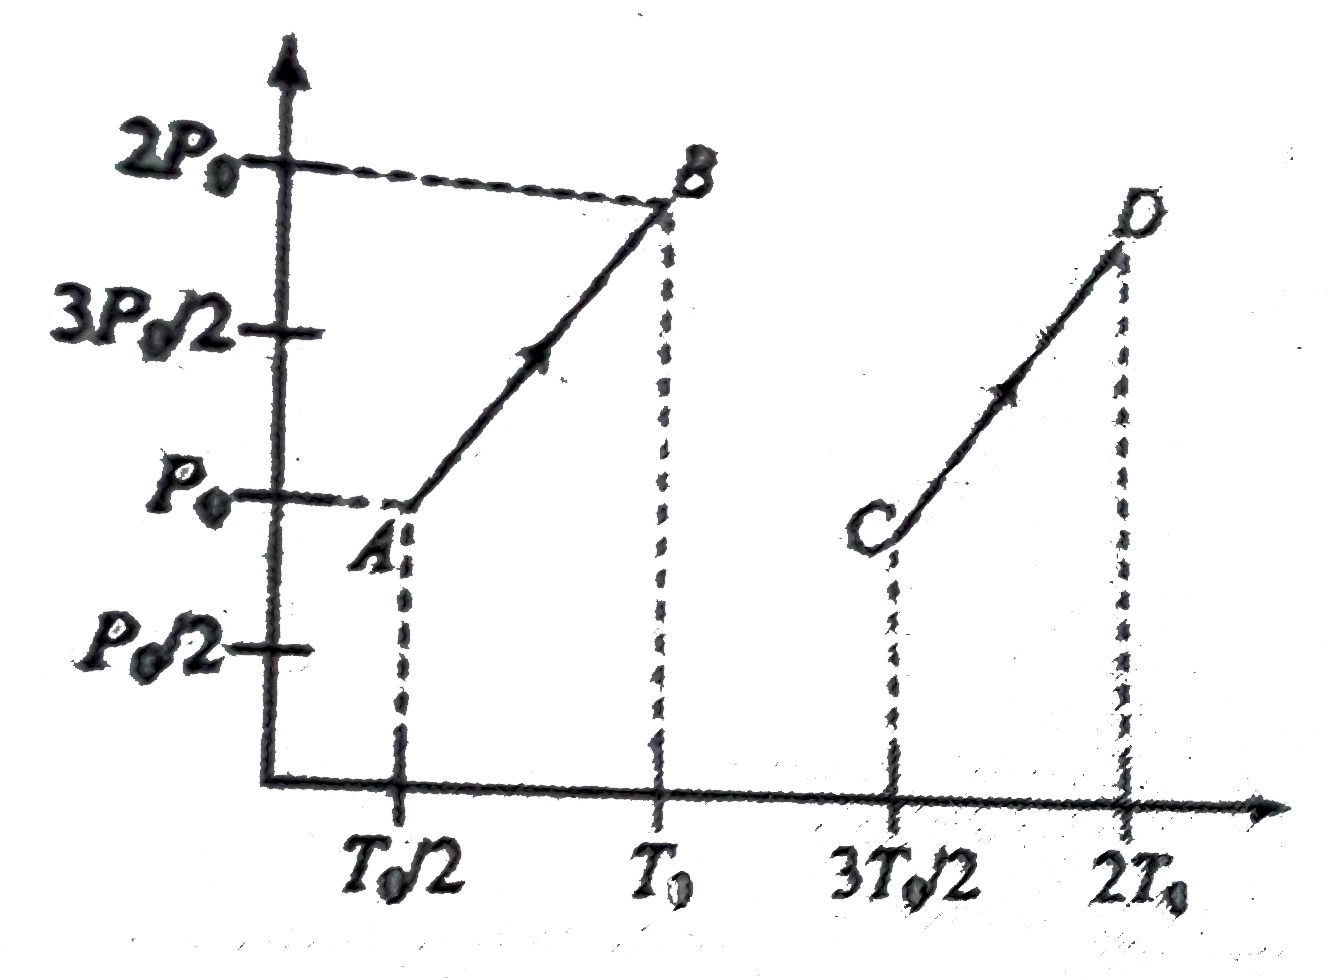
View SolutionP-T graph for same number of moles of two ideal gases are shown . Find the path along which volume decreases .

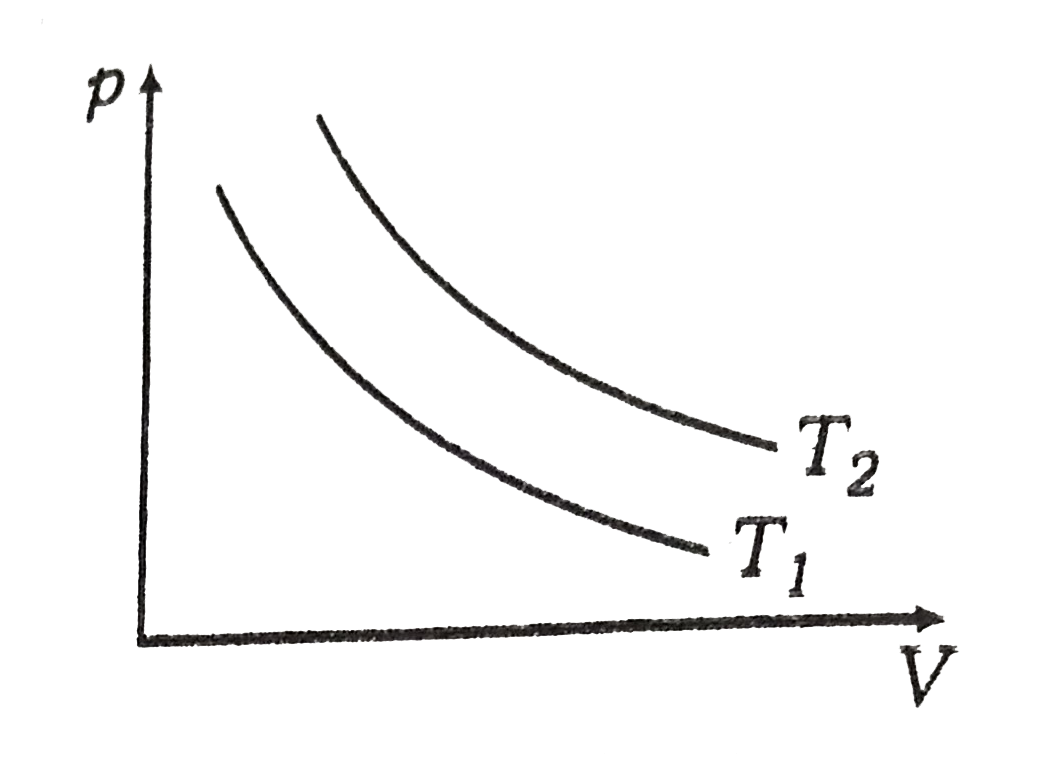
View SolutionThe adjoining fgure shows graph of pressure and volume of a gas at two temperatures T1 and T2 Which one the following is correct

View SolutionA graph is plotted between PVm along y-axis and P along x-axis, where Vm is the molar volume of a real gas. Find the intercept .
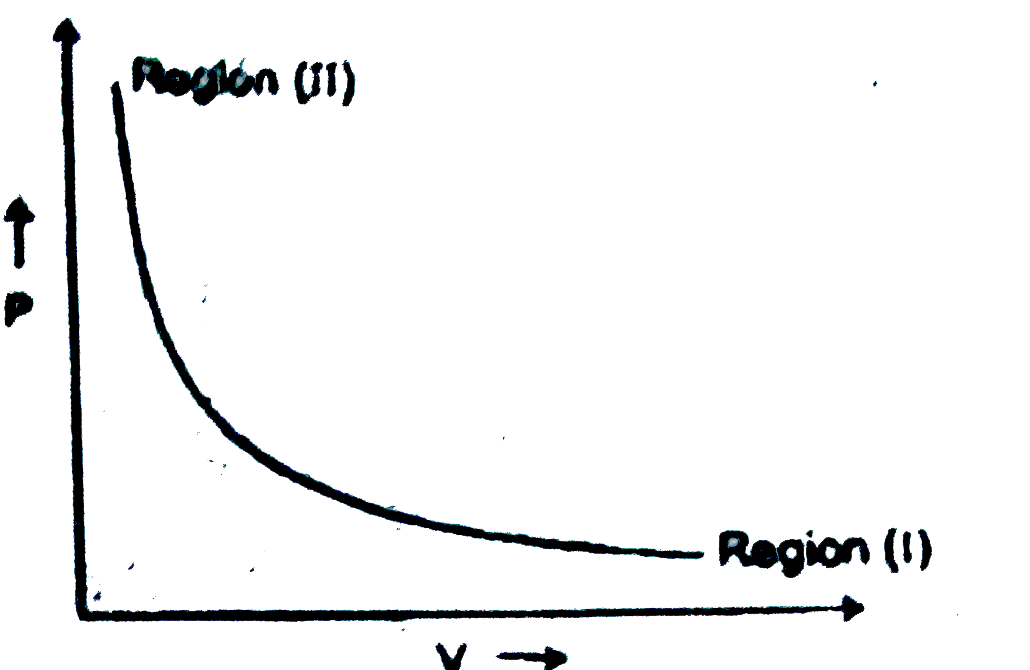
View SolutionFollowing graph represents a pressure (P) volume (V) relationship at a fixed temperature (T) for n moles of a real gas. The graph has two regions marked (I) and (II). Which of the following options is true.

View SolutionFollowing graph represents a pressure (P) volume (V) relationship at a fixed temperature (T) for n moles of a real gas. The graph has two regions marked (I) and (II). Which of the following options is true.
View SolutionA given sample of an ideal gas occupise a volume V at a pressure p and absolute temperature T.The mass of each molecule of the gas is m. Which of the following is the density of the gas ?
View SolutionWhen 1 mole gas is heated at constant volume, temperature is raised from 298 to 308 K. Heat supplied to the gas in 500 J. Then, which statement is correct ?
View Solution